
Fig. 7. Experience curve (blue) and cumulative cost curve (grey), as well as the implemented piecewise linearisation (hashed green line) with in this case four line segments.
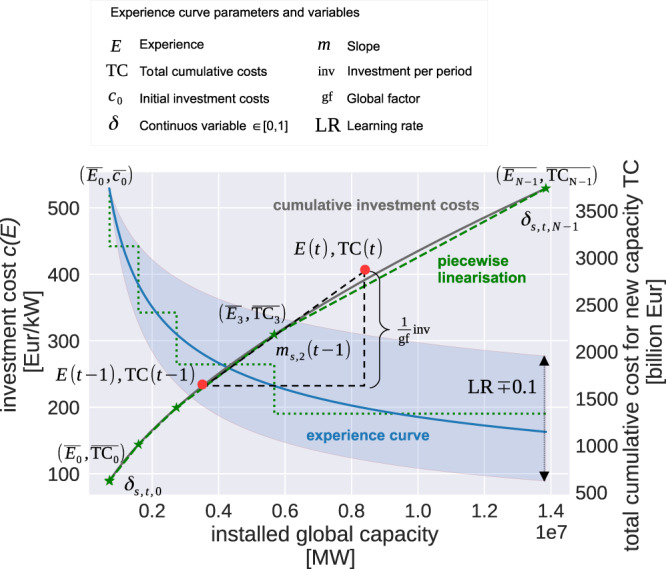
The shaded blue area shows the variation of the learning rate LR by ± 10%. The experience E is defined as the cumulative installed capacity. Investment costs c are decreasing with increasing experience. From the slope m between the experience E and the total cumulative cost TC at two different time steps, we calculate the investment per period inv. Since we model only Europe, global developments are represented by the global factor gf.