
FIGURE 5.
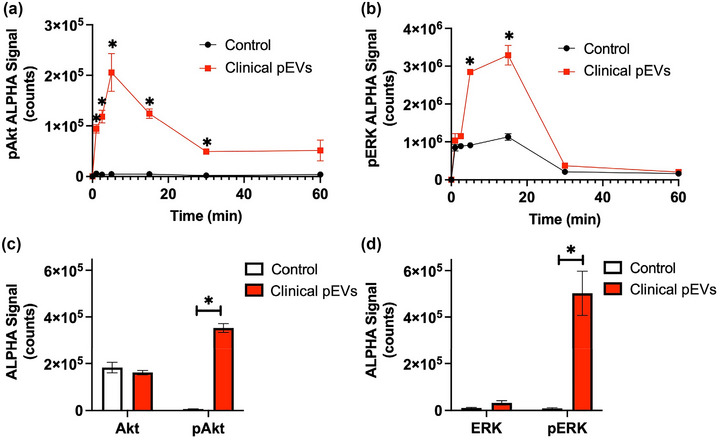
Measurement of (a) pAkt/Akt and (b) pERK/ERK ratios over time when untreated (black) or treated with pEVs (red). Comparison of (c) Akt and pAkt levels, and (d) ERK and pERK levels in cells after 5 min incubation with clinical pEVs (red) as opposed to untreated cells (white). n = 6, *p < 0.05, one‐way ANOVA.