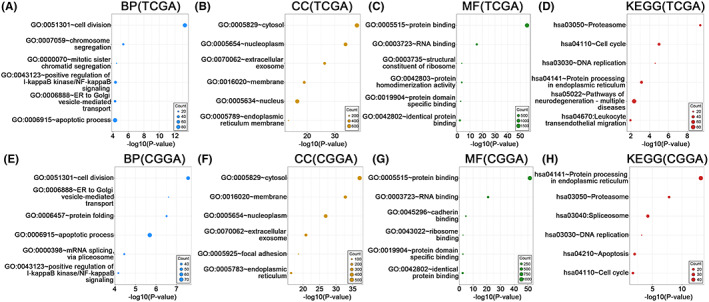
FIGURE 7.

GO functional enrichment analysis and KEGG pathway enrichment analysis of positively AK2‐related genes (R > 0.5, p < 0.05) in TCGA and CGGA. (A–D) Biological processes (BP), cellular components (CC), molecular functions (MF), and KEGG pathways involved with AK2 from the TCGA. (E–H) Biological processes (BP), cellular components (CC), molecular functions (MF), and KEGG pathways involved with AK2 from the CGGA. The circle size represents the size of the relevant gene set contained in the pathway, and the larger the circle, the more relevant genes are contained.
