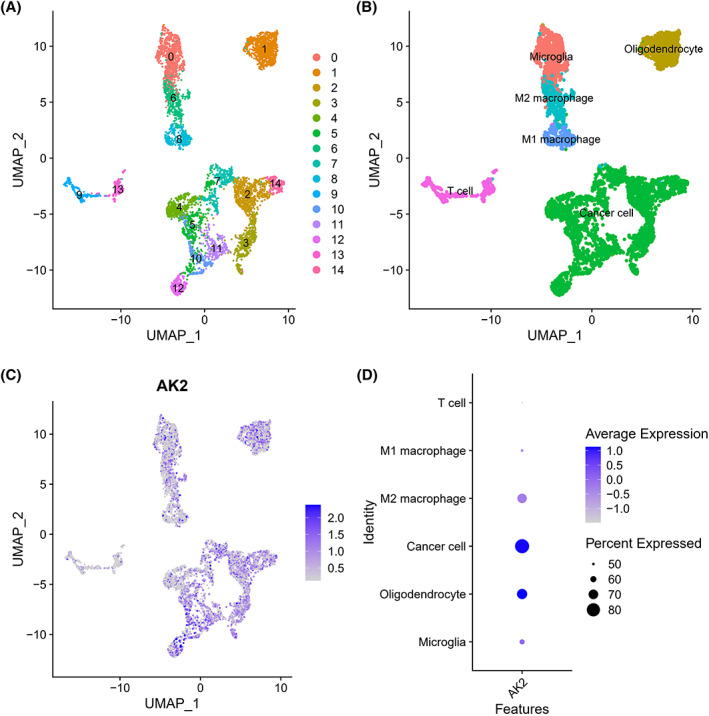
FIGURE 11.

Single‐cell analysis of single‐cell mRNA sequence. (A) A two‐dimensional UMP plot depicted that 6148 single cells were divided into 15 clusters and displayed in different colors. (B) The 15 clusters were annotated as six types of cells: cancer cell, oligodendrocyte, microglia, M2 macrophage, M1 macrophage, and T cell. (C) AK2 expression in each cell. (D) The bubble plot showed AK2 expression in different types of cells.
