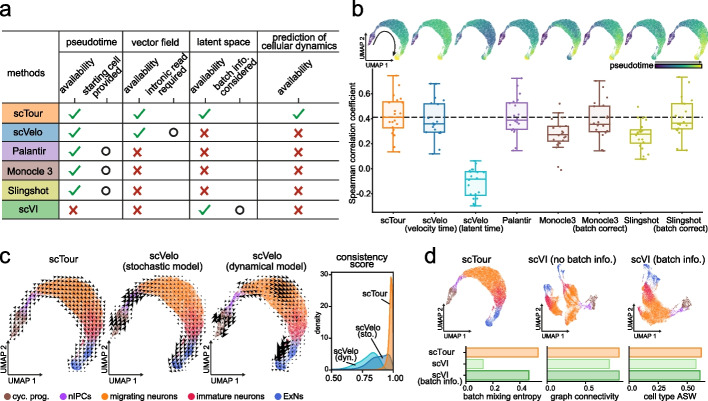
Fig. 5.
Benchmarking scTour against existing methods. a Table summarizing the functionalities and features of scTour versus other methods. b Top panels: UMAP visualizations of the pseudotime estimated by different algorithms along the excitatory neuron development (36,318 cells [25]). Bottom panel: Box plot showing the Spearman correlation coefficients calculated between the pseudotime estimates and the expression profiles of 20 well-established marker genes along the excitatory neuron developmental trajectory (see “Methods”). The horizontal dotted line denotes the median value from scTour. c UMAP visualizations of the vector fields from scTour (left), scVelo’s stochastic (middle) and dynamical (right) models, with colors indicating different cell types. The rightmost panel illustrates the distributions of the consistency scores calculated between each cell and its neighboring cells based on the vector fields derived from each method. cyc. prog., cycling progenitors; nIPCs, neuronal intermediate progenitor cells; ExNs, excitatory neurons. d Top panels: UMAP visualizations based on the latent space from scTour (left), scVI without batch correction (middle), and scVI with batch information incorporated during model training (right). Cells are color-coded by cell types as in c. Bottom panels: metrics quantifying the degree of batch correction (batch mixing entropy and graph connectivity) and biological signal conservation (cell type ASW) for each method. ASW, average silhouette width

