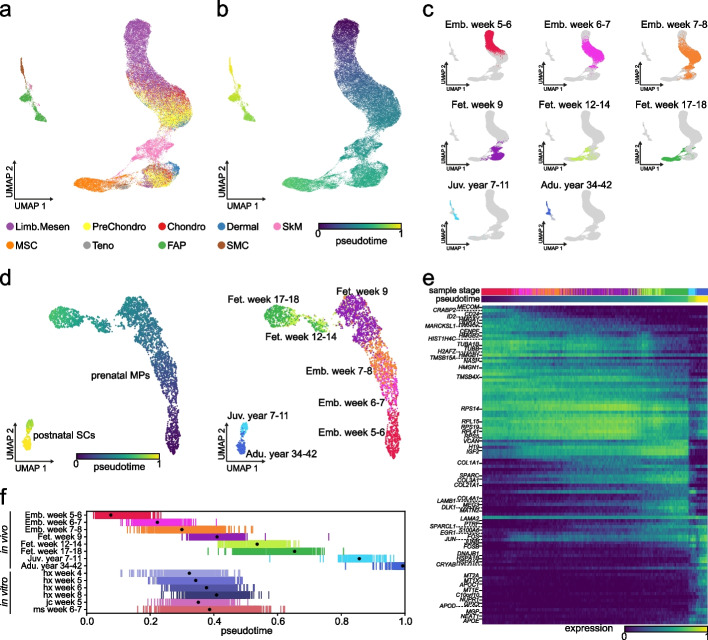
Fig. 6.
Application of scTour to human skeletal muscle development. a scTour’s latent space-based UMAP visualization of the cell types from all stages during human limb development (58,021 cells) [34]. Limb.Mesen, limb mesenchymal cells; PreChondro, prechondrogenic cells; Chondro, chondrogenic cells; Dermal, dermal fibroblasts; SkM, skeletal muscle cells; MSC, mesenchymal stromal cells; Teno, tenogenic cells; FAPs, fibro-adipogenic progenitors; SMC, smooth muscle cells. b As in a, but colored by the pseudotime estimated by scTour. c UMAP plots displaying cells from each of the developmental stages represented by different colors. d scTour’s latent space-based UMAP representations of the skeletal muscle progenitor and stem cells collected across prenatal and postnatal development (4816 cells), with colors indicating pseudotime estimates from scTour (left) and real developmental stages (right). e Heatmap illustrating the expression dynamics of top 100 most significant genes along the developmental trajectory. Developmental stages and estimated pseudotime are displayed on top. f Ordering of the in vivo skeletal muscle progenitor and stem cells based on the inferred pseudotime (upper), and ordering of the in vitro hPSC-derived progenitors based on the predicted pseudotime (lower). Dots denote the median values. Colors represent the developmental stages as in d (upper) and directed differentiation protocols and time points (lower)

