

Abstract
Gliomas are characterized by diffuse infiltration of tumor cells into surrounding brain tissue, and this highly invasive nature contributes to disease recurrence and poor patient outcomes. The molecular mechanisms underlying glioma cell invasion remain incompletely understood, limiting development of new targeted therapies. Here, we have identified phosphotyrosine adaptor protein ShcD as upregulated in malignant glioma and shown that it associates with receptor tyrosine kinase Tie2 to facilitate invasion. In human glioma cells, we find that expression of ShcD and Tie2 increases invasion, and this significant synergistic effect is disrupted with a ShcD mutant that cannot bind Tie2 or hyperphosphorylate the receptor. Expression of ShcD and/or Tie2 further increases invadopodia formation and matrix degradation in U87 glioma cells. In a co-culture model, we show that U87-derived tumor spheroids expressing both ShcD and Tie2 display enhanced infiltration into cerebral organoids. Mechanistically, we identify changes in focal adhesion kinase phosphorylation in the presence of ShcD and/or Tie2 in U87 cells upon Tie2 activation. Finally, we identify strong a correlation between transcript levels of ShcD and Tie2 signaling components as well as N-cadherin in advanced gliomas and those with classical or mesenchymal subtypes, and we show that elevated expression of ShcD correlates with a significant reduction in patient survival in higher grade gliomas with mesenchymal signature. Altogether, our data highlight a novel Tie2-ShcD signaling axis in glioma cell invasion which may be of clinical significance.
Keywords: Glioma, ShcD/SHC4, Tie2, Fak, invasion, cerebral organoid
INTRODUCTION
Gliomas are the most prevalent primary tumors of the central nervous system and they are classified from grades 1–4 according to their degree of malignancy (1,2). Among the deadliest forms is glioblastoma multiforme (GBM), which is characterized by increased mitotic activity, high vascular proliferation, and diffuse infiltration into surrounding brain tissue, with a median survival of 12–15 months following surgical resection and adjuvant therapy (3). Glioma cells are highly invasive and as a consequence, disseminated tumor cells which escape resection result in disease recurrence and lead to the poor prognosis of GBM (4). Infiltrating glioma cells develop actin-rich protrusions called invadopodia which engage in proteolytic activity and degrade the surrounding extracellular matrix (ECM) to facilitate invasion (5). Activation of growth factor signaling pathways involving receptor tyrosine kinases (RTKs) such as epidermal growth factor receptor (EGFR), as well as non-receptor tyrosine kinases including focal adhesion kinase (FAK/PTK2) and Src, can modulate invadopodia dynamics (6), and a recent study has suggested that it might be possible to target invadopodia to inhibit GBM cell invasion (7). Improved understanding of molecular mechanisms that drive invadopodia formation is therefore needed to identify novel therapeutic strategies to limit glioma invasiveness.
ShcD (also known as SHC4) is a member of the Shc family of phosphotyrosine adaptor proteins characterized by an N-terminal phosphotyrosine binding (PTB) domain and a C-terminal Src homology 2 (SH2) domain. Shc proteins link activated RTKs with downstream effectors to regulate key cellular processes such as proliferation, migration and endocytosis (8). We and others have previously reported that ShcD binds EGFR and promotes EGF-dependent cell migration (9,10), and that ShcD induces ligand-independent activation of EGFR (10). Of note, we have also demonstrated highly variable but significant ShcD upregulation in malignant human gliomas compared to their benign counterparts that is coincident with EGFR hyperphosphorylation (10). In addition to its expression in gliomas, ShcD is also upregulated in metastatic human melanomas and silencing of ShcD results in decreased growth of xenografted tumor cells (9). Despite emerging evidence implicating ShcD in advanced cancers, its precise molecular and cellular functions in these contexts remain to be defined.
In a search for novel drivers of ShcD signaling in glioma, we have identified the Tie2 (TEK) RTK as a potential ShcD binding partner. Tie2 was initially characterized as an endothelial cell-specific receptor (11), however it has since been shown to display elevated expression in invasive tumors including gastric cancer (12), breast cancer (13), and gliomas where its expression parallels increasing malignancy (14). Autophosphorylation of Tie2 on a trio of intracellular tyrosine residues creates recognition sites for intracellular signaling molecules containing PTB or SH2 domains, including Grb2, Dok2, PI3-kinase, Shp2, and ShcA (15–17). In glioma cells, activation of Tie2 by its ligand Angiopoietin-1 (Ang-1/ANGPT1) enhances expression of ß1-integrin (ITGB1) as well as matrix adhesion (18) and invasion (19), and targeting of Tie2 has been used in experimental models of glioma (20).
In this study, we demonstrate that both the PTB and SH2 domains of ShcD can associate with Tie2, and that ShcD binding leads to hyperphosphorylation of Tie2. In U87 glioma cells stably expressing wild-type ShcD and/or Tie2, we further show that both ShcD and Tie2 enhance invadopodia formation and matrix degradation, and we identify a significant synergistic effect of ShcD and Tie2 co-expression on glioma cell invasion which is lost when the PTB and SH2 domains of ShcD are mutated. This phenotype is similarly seen in U87 spheroids co-cultured with cerebral organoids derived from human stem cells. Mechanistically, we show that phosphorylation of FAK is decreased upon Ang-1 stimulation in U87 cells expressing ShcD and/or Tie2. Finally, using public human glioma datasets, we reveal that ShcD mRNA expression correlates with Tie2 signaling and markers of the epithelial-mesenchymal transition (EMT) required for invasion, as well as decreased patient survival. Altogether, we have uncovered a novel role for ShcD in connecting Tie2 with FAK signaling which may have implications in invasive gliomas.
MATERIALS AND METHODS
Plasmids
Full length cDNA encoding wild-type human ShcD (BC033907) and its domain-inactive variants generated by point mutation: ShcD-PTB* (R315Q), ShcD-SH2* (R548K), and ShcD-PTB*/SH2* (ShcD-P*/S*) were previously cloned into pcDNA3 vector with a C-terminal 3xFLAG epitope (21). Similarly, ShcA-SH2, ShcD-SH2 and ShcD-SH2* were previously cloned into pGEX-4T-1 as GST-fusion constructs. Wild-type Tie2 (Tie2-WT), its kinase dead counterpart Tie2-KD (K853A), and three C-terminal tail tyrosine-to-phenylalanine variants Tie2-Y1100F, Tie2-T1106F, and Tie2-Y1111F were cloned into pcDNA3 vector, as previously reported (15).
Antibodies and growth factors
The following antibodies were commercially obtained and used for Western blot analysis at indicated dilutions (diluted in 1x TBST): mouse anti-FLAG clone-M2 at 1:1000 (Sigma-Aldrich; Cat. #F3165, RRID:AB_259529); rabbit anti-pShc at 1:1000 (pY239/240; Cell Signaling Technology; Cat. #2434S, RRID:AB_10841301); mouse anti-Tie2 at 1:1000 (BD Biosciences; Cat. #557039, RRID:AB_396562); rabbit anti-FAK at 1:1000 (Cell Signaling Technology; Cat. #3285, RRID:AB_2269034); mouse anti-pFAK clone-M121 at 1:1000 (pY397; Abcam; Cat. #ab24781, RRID:AB_448317); rabbit anti-Src at 1:1000 (Cell Signaling Technology; Cat. #2108, RRID:AB_331137); rabbit anti-non-phospho-Src at 1:1000 (Y527; Cell Signaling technology; Cat. #2107S, RRID:AB_331081), mouse anti-GST clone-B-14 at 1:2000 (Santa Cruz Biotechnology; Cat. #SC-138, RRID:AB_627677), and mouse anti-ß-actin at 1:3000 (Sigma-Aldrich; Cat. #A2228, RRID:AB_476697). Rabbit anti-pTie2 at 1:500 (pY992; Cell Signaling Technology; Cat. #4221S, RRID:AB_2203198) was a generous gift from Dr. Brenda L. Coomber (Department of Biomedical Sciences, Ontario Veterinary College, University of Guelph). Mouse anti-phosphotyrosine clone-4G10 at 1:1000 was obtained from Sunnybrook Hybridoma Bank (Toronto, Canada). Horseradish peroxidase (HRP)-conjugated goat anti-rabbit and goat anti-mouse (Bio-Rad Laboratories; Cat. #1706515 [RRID:AB_2617112] and #1706516 [RRID:AB_11125547] respectively) antibodies were used as secondary antibodies. Stable U87 cells were incubated overnight at 37°C in serum-free medium and stimulated with 100ng/mL of recombinant human Ang-1 (Peprotech®; Cat. #130–06) for 20 min prior to cell lysis.
Cell culture and Lysis
Human embryonic kidney (HEK) 293T, U87, and T98G malignant glioma cell lines obtained from the American Type Culture Collection (Manassas, USA) were grown in Dulbecco’s Modified Eagle medium (DMEM) (Sigma-Aldrich) supplemented with 10% Fetal Bovine Serum (FBS), 200 Units/mL of penicillin and streptomycin each (Invitrogen™), and maintained at 37oC with 5% CO2. All three cell lines were authenticated with GenePrint®10 (Promega) and confirmed negative for Mycoplasma contamination using e-Myco™ valid Mycoplasma PCR detection kit (iNtRON Biotechnology; Cat. #25239) according to manufacturer’s instructions.
HEK293T cells were transfected using polyethylenimine (PEI), U87 cells with Lipofectamine 2000 (Invitrogen™; Cat. #11668019), and T98G cells with Lipofectamine 3000 (Invitrogen™; Cat. #L3000015) for 24 hrs (or 6 hrs followed by media replacement in case of Lipofectamine reagent) and starved in serum-free DMEM overnight prior to lysis (see Supplementary Methods).
Generation of stable cell lines
First, optimal Geneticin® reagent (G418) dosage was determined by kill curves. U87 or T98G glioma cell lines stably expressing either Flag-tagged empty pcDNA3 vector (Control), only wild-type ShcD (ShcD-WT), only wild-type Tie2 (Tie2-WT), both wild-type ShcD and Tie2 (ShcD-WT + Tie2-WT), and ShcD with mutated PTB and SH2 domains and wild-type Tie2 (ShcD-P*/S* + Tie2-WT; U87 cells only) were generated, selected for, and subsequently maintained with G418 at a concentration of 750 μg/mL in DMEM containing 10% FBS.
Lentiviral production and cell infection
The pWPXLd-EGFP plasmid was a gift from Didier Trono (Addgene plasmid #12258). Lentiviral particles to deliver the plasmid were produced using the Lenti-X Packaging Single Shots (VSV-G) system (Clontech; Cat. #631275) and Lenti-X 293T cell line (Clontech; Cat. #632180), according to manufacturer’s protocol. Viral pellets were re-suspended in PBS and aliquots stored at –80°C. For transduction, fresh culture medium containing 100μL of lentiviral particles was added to U87 cells in 6-well plates and cells were incubated for 24 hrs. Next day, the culture medium was replaced with fresh virus-free medium and cells were allowed to incubate for another 48 hrs and inspected for GFP expression before proceeding to spheroid generation as stated below.
Generation of tumor spheroids
Tumor spheroids were generated from U87 cells stably expressing wild-type ShcD and/or Tie2 in 96-well round bottom spheroid microplates (Corning®; Cat. #4515). 5×10³ cells (gelatin migration assay) or 18×103 GFP-expressing cells (organoid co-culture assay) were seeded and allowed to form spheroids over 96 hrs. 3–5 uniform-sized spheroids were then selected for further analysis.
Generation of cerebral organoids
The human iPSC line used in this study was described previously (22). Briefly, iPSCs were generated from dermal skin punch (3 mm3)-derived fibroblasts obtained with informed written consent from one healthy adult control subject at the Massachusetts General Hospital (MGH), Department of Psychiatry, and reprogrammed as iPSCs using a non-integrative, mRNA-based technology by Cellular Reprogramming, Inc. (www.cellular-reprogramming.com). The study protocol was approved by the Institutional Review Board of the Massachusetts General Hospital in accordance with U.S. Common Rule ethical guidelines. iPSCs were cultured on rLaminin-521 (Corning®; Cat. #354222) with Nutristem XF/FF Medium (Biological Industries; Cat. #05–100-1A). Cerebral organoids were generated from an iPSC line using the STEMdiff™ Cerebral Organoid Kit (Stem Cell Technologies, Cat. #08570), according to manufacturer’s protocol. Use of the patient-derived iPSC line and generation of cerebral organoids was approved by the University of Guelph Research Ethics Board (REB 17–11-012). Briefly, on day = 0, cells were detached with Gentle Cell Dissociation Reagent (StemCell™ Technologies; Cat. #07174), washed, and re-suspended in embryoid body (EB) Seeding Medium. Next, 9×10³ cells were seeded in a 96-well round-bottom ultra-low attachment plate (Corning®, Cat. #7007) to allow EB formation. On day = 5, EBs were transferred into a 24-well ultra-low attachment plate (Corning®; Cat. #3473) containing 500μL of fresh Induction Medium per well and incubated for 48 hrs at 37°C. On day = 7, organoid embedding sheets (StemCell™ Technologies; Cat. #08579) were placed in a sterile 10cm dish and single EBs were gently transferred to the embedding surface. Excess medium was removed and 15μL of Matrigel™ was added dropwise onto each EB with a cold 200μL standard pipette tip. Following polymerization at 37°C for 30 min, Matrigel™ droplets were gently washed off from the sheet into wells of a six-well ultra-low adherent plate (Corning®; Cat. #3471) containing Expansion Medium. Embedded organoids were incubated at 37°C for 3-days until day = 10, and medium was replaced with 3 mL/well of Maturation Medium (Stem Cell Technologies; Cat. #08571). Finally, organoids were placed on an orbital shaker in a 37°C incubator and agitated at 65 rpm until specimens reached day = 60 with complete Maturation Medium replacement every 3–4 days.
Transwell invasion assay
Bottoms of Corning® Transwell inserts (8 μm pore diameter; Cat. #CLS3442) were coated with 20 μg/mL fibronectin (Sigma; Cat. #F1141–1MG) and tops were coated with 0.2 mg/mL Corning® Matrigel™ (Cat. #354234). 4.0×10⁵ cells were seeded in 24-well cell culture plates in DMEM containing 2% FBS in the upper chamber of each well and DMEM containing 10% FBS in the lower chamber. Cells were allowed to invade into the Matrigel™ for 20 hrs at 37°C following which the Matrigel™ containing invaded cells was removed. The membranes of transwells were then fixed and stained with 1% crystal violet in 20% methanol solution. Following three successive washes with 1x PBS, membranes were removed, and crystal violet was eluted in 10% acetic acid. Finally, the absorbance (562 nm) of eluates was measured to quantify invasion.
Invadopodia formation and gel degradation assay
25 mm glass coverslips (Fisher Scientific; Cat. #12–545-102) were coated with 50 μg/mL of poly-L-lysine (Sigma; Cat. #p628–5ML) in PBS and cross-linked with 0.5% glutaraldehyde (Sigma; Cat. #G7651–10ML) in PBS. 2 mg/mL gelatin was labelled with 594 fluorescent probes using the Alexa Fluor Protein Labeling Kit (ThermoFisher Scientific™; Cat. #A10239) and diluted 1:7 with unlabeled gelatin. Coverslips were inverted onto 70 μL drops of gelatin and placed on a shaker immersed in 5 mg/mL NaBH3 in PBS solution, and washed with 1x PBS. U87 cells stably expressing ShcD and/or Tie2 (or Control) were seeded at a density of ~2×10⁶ cells/well on pre-coated glass coverslips in DMEM containing 10% FBS and processed either 4 hrs (for invadopodia formation) or 24 hrs (for gel degradation) after seeding. After removal of culture medium, cells attached to coverslips were first fixed in 4% paraformaldehyde (Electron Microscopy Sciences; Cat. #15710-S), then washed in 150 mM glycine, followed by permeabilization in 0.1% Triton X-100 (Sigma; Cat. #9002–93-1) and finally blocking in 5% BSA (Roche; Cat. #10735086001). Coverslips were stained with mouse anti-Flag primary antibody (M2) (Sigma; Cat. #F1804); Alexa Fluor 488 goat anti-mouse secondary antibody (Life technologies; Cat. #A11001); Alexa Fluor 647 phalloidin (Invitrogen™; Cat. #A22287) and Hoechst 33258, pentahydrate (bis-benzamide) (Molecular Probes; Cat. #H-1398). Finally, coverslips were mounted on microscope slides (Fisher; Cat. #12–550-15) using Prolong Diamond Antifade Mountant (Invitrogen™; Cat. #P36961) and quantification of invadopodia formation and gelatin degradation was performed using a 63x lens on a Nikon Eclipse Ti Microscope (Minato, Japan). Fifty cells with positive expression from the 4-hr timepoint were randomly selected and scored as being either positive or negative for invadopodium formation. Likewise, fifty cells with positive expression were randomly chosen from the 24-hr timepoint, and degradation areas were counted and scored as the percentage of area degraded per cell (+1 for fully degraded, +0.5 for partially degraded, and 0 for no degradation). Finally, the total score for each condition was calculated.
Spheroid migration assay
Individual spheroids (generated as described above) were transferred onto a 96 well plate coated with gelatin and cells were allowed to migrate out from the spheroid for up to 72 hrs. Individual wells were imaged at 0, 12, 24, 36, 48 and 72 hrs on a Leica DMIRE2 microscope. Images were combined using a custom script (Adobe Photoshop CS5) to generate a panorama image of the well at each timepoint. Spheroids touching the edge of a well were excluded from analysis. For each image, the linear distance from the edge of the spheroid to the boundary was measured along a straight line perpendicular to the centre of the spheroid at multiple locations and the largest measurement was recorded as the migrated distance. All values at t = 0 were set to 0.
Organoid co-culture assay
Cerebral organoids were transferred to a 50 mL conical tube, washed 3x with PBS, and then fixed in 4% paraformaldehyde in PBS overnight at 4°C. On the next day, specimens were washed 3x with PBS followed by overnight incubation at 4°C in 30% sucrose solution. The next day, organoids were embedded in a 7.5% gelatin in 10% sucrose solution (Sigma, Cat. #G2500; ThermoFisher™, Cat. #BP220–212) and snap-frozen using a dry-ice::ethanol mixture. 30 μm-thick sections were sliced using Leica CM1860 cryostat, captured on subbed glass slides, air dried, and then maintained at −80°C until histological processing. For immunostaining, sections were washed 3x with PBS for 10 min each, blocked with PBS containing 10% goat serum for 30 min, followed by overnight incubation at 4°C with primary antibody solution with mouse anti-TUBB3 (clone-Tuj1) (Biolegend®; Cat. #801213, RRID:AB_2728521) and chicken anti-GFP (Invitrogen™; Cat. #A10262, RRID:AB_2534023). The next day, sections were washed 3x in PBS followed by incubation for 2 hrs at RT in Alexa-594- or Alexa-488-conjugated antisera (ThermoFisher Scientific™, Cat. #A11005 [RRID:AB_2534073] and #A11039 [RRID:AB_2534096] respectively). After incubation, sections were briefly washed with PBS, counterstained with 4’,6-diamidino-2-phenylindole (DAPI) and immediately cover-slipped with ProLong AntiFade mounting medium (Molecular Probes; Cat. #P36961).
Organoid co-culture assay image analysis
Up to 15 sections were collected for each group from 3 organoids, which were then stained and imaged. Glioma cell invasion into the organoids was quantified using ImageJ software by first overlaying digital images acquired from GFP (GFP-expressing GBM cells) and RFP channels (Tuj1-positive organoid), and employing color thresholding in order to calculate dispersion of glioma cells within the organoid. Organoid surface was then approximated based on area measurement of Tuj1-positive cells. To measure the area covered by invading glioma cells, hue settings were arranged to select only co-localized areas within the total body of organoid and pixels for each image set were recorded. The same background/foreground cut-off threshold was used for all conditions. Finally, percent co-localized areas were calculated using the formula:
Immunofluorescence and Confocal Imaging
For invadopodia-forming and substrate degrading cells, confocal images were taken using a 63x (numerical aperture 1.4) oil immersion lens on a Leica DMIRE2 inverted microscope with a TCS SP2 scanning head (Leica Microsystems, Heidelberg, Germany) and associated software by focusing at the ventral surface of the cells. All images were processed and analyzed using ImageJ software (National Institutes of Health, Bethesda, MD). For imaging of spheroids and organoids, overlapping grayscale images of DAPI, Tuj1 (TUBB3), and GFP fluorescence signals were collected using a 4x or 20x objective and a Nikon Eclipse Ti2-E inverted microscope (Nikon Instruments, NY, USA) equipped with a motorized stage and image stitching capability. Image deconvolution and analysis was conducted using NIS-Elements Viewer software (Nikon Instruments, NY, USA).
Bioinformatics
To compare distribution patterns of ShcD mRNA expression, TCGA-GBM+LGG (n = 703) and TCGA-GBM (n = 174) mRNA-Seq harmonized (hg38) datasets were accessed and retrieved from Genomic Data Commons (GDC) (23) using the TCGABiolinks R package (24) as raw HT-Seq counts. After removal of duplicate genes, reads were then TMM-normalized (25) and voom transformed (26). Additionally, RSEM-normalized counts of mRNA-Seq data and associated clinical information of n = 693 (CGGA_693) and n = 325 (CGGA_325) patients were downloaded from the CGGA website (cgga.org.cn) (27). For survival analysis, median ShcD expression was selected as the cut-off value and patients were categorized as expressing either high or low ShcD. Kaplan-Meier curves representing overall survival of patient groups were subsequently generated using survminer (28) and survival (29) R packages. Cox proportional hazards (univariate) model was used to identify risk associated with ShcD expression on median overall survival within a 95% confidence interval. Finally, correlation analysis was performed using the corrplot R (30) package.
Amino acid sequences for human ShcD (Q6S5L8) and Tie2 (Q02763) were retrieved from UniProt (31). Protein-Protein Interaction Engine version 3b (PIPE 3b) (32) was used to predict interacting residues or regions between human ShcD and Tie2 proteins. The STRING (v10.5; http://string-db.org) (33) database of known and predicted protein-protein interactions was used to analyze ShcD interaction network and the combined scores (i.e. indicators of confidence) for each interaction were ranked from 0 to 1, with 1 being the highest possible confidence (34). Statistically relevant, high confidence interactions were defined as combined score > 0.6 and ShcD PPI network was visualized using stringApp plugin in Cytoscape (v3.7.2) (35,36).
RNA-sequencing data for U87 and U251 cell lines (Acc. #PRJNA183192) was downloaded from the Human Protein Atlas v19.2, and ShcD and Tie2 transcript expression levels (normalized expression, NX) were plotted. Threshold of detection: NX=1.
Densitometry and Statistics
To calculate relative band intensities, films were imaged and quantitated using Image Lab v5.2 software (Bio-Rad Laboratories). All statistical calculations were performed using R and visualized using R packages ggplot2 and ggpubr (37,38). Kruskal-Wallis ANOVA followed by Tukey’s HSD test were used for multiple comparisons while the latter was used specifically to obtain adjusted p-values for significant pairs. For continuous data, readings were analyzed by repeated measures (RM) one-way ANOVA. In all cases, threshold of significance was set to P < 0.05.
RESULTS
Bioinformatic analysis of The Cancer Genome Atlas and the Chinese Glioma Genome Atlas datasets reveals varying ShcD mRNA expression levels in different glioma grades and molecular subtypes.
We have previously reported high ShcD mRNA expression in malignant gliomas compared to their benign counterparts (10), and we found this to be reproducible in two larger well-characterized cohorts, The Cancer Genome Atlas (TCGA-GBM+LGG and TCGA-GBM datasets) as well as the Chinese Glioma Genome Atlas (CGGA_325 and CGGA_693 datasets). In the TCGA-GBM+LGG dataset, we found median ShcD expression to be elevated in all glioma tumor specimens, with significantly higher ShcD expression in Grade 3 (G3) compared to Grade 2 (G2) gliomas (P < 0.05; Fig. S1A). Despite ShcD upregulation in malignant Grade 4 (G4) samples compared to non-tumor samples, the increase did not reach significance, likely owing to the variability in ShcD expression in these tumors (Fig. S1A), consistent with our earlier findings (10). Similarly, we found ShcD mRNA expression to be significantly higher in G3 as well as G2 gliomas compared to G4 gliomas within the CGGA_693 dataset (P < 0.01; Fig. S1B) and the CGGA_325 dataset (P < 0.001, G2 and P < 0.05, G3; Fig. S1C). We then analyzed ShcD expression across GBM subtypes, in accordance with the molecular classification detailed by Verhaak et al. (39). We found significant upregulation of ShcD in groups of patients representing the classical (CL) subtype compared to mesenchymal (ME) and proneural (PN) subtypes in the TCGA-GBM dataset (P < 0.05; Fig. S1D), and this observation was similarly seen in CL samples within the CGGA_693 dataset (P < 0.05; Fig. S1E) but not the CGGA_325 dataset (Fig. S1F). Together these results suggest that upregulation of ShcD expression is correlated with advanced gliomas.
ShcD interacts with the C-terminal tail of Tie2 and promotes its hyperphosphorylation.
Based on prior knowledge of ShcD association with MuSK (21), EGFR (10) as well as neurotrophic receptors of the Trk family (40), we questioned whether ShcD binds to other RTKs known to be altered in gliomas. Using open-source prediction of functional interactions to extract high confidence links, we identified Tie2 as a potential candidate, with a combined STRING score of 0.68 (Fig. 1A). We then used Protein-Protein Interaction Prediction Engine v3b (PIPE3b) (32) to predict regions that may enable ShcD and Tie2 to associate with each other (Fig. 1B). The results are represented as peaks, where the magnitude of a peak corresponds to the likelihood that residues from the two contributing proteins will interact at that position. From this, it was predicted that tyrosine residues located on the C-terminal tail of Tie2 would contribute to the interaction and for ShcD, the most likely site of interaction would span the C-terminal SH2 domain, with a minor contribution from the PTB domain region (Fig. 1B,C). To confirm this, HEK293T cells were transiently transfected with auto-active wild-type (WT) Tie2 or vector alone, and lysates were incubated with GST-tagged ShcD-SH2 or mutated ShcD-SH2* domains immobilized on glutathione beads. GST-ShcA-SH2 was used as a positive control. The ShcD-SH2 domain successfully co-precipitated Tie2, and this association was lost with the ShcD-SH2* variant, which cannot recognize phosphotyrosine (Fig. 1D).
Figure 1: In silico prediction of ShcD-Tie2 interacting residues and validation by GST pull-down assay.

(A) Cytoscape-generated image of predicted ShcD binding partners accessed using the STRING database where genes are represented as nodes and colors of the edges correspond to combined interaction prediction scores from 0.6–1.0. Selected candidate binding partner, TEK (Tie2) is indicated in blue (STRING score=0.68). (B) 3D surface plot reconstructed from raw data downloaded from Protein-Protein Interaction prediction engine v3b (PIPE3b), with peaks representing location and likelihood of potential interaction sites between human ShcD and Tie2. Data corresponding to Tie2 residues 1106–1124 and ShcD residues 612–630 was unavailable. (C) Schematic illustrations of ShcD and Tie2 domain architectures showing key phosphotyrosine residues. (D) Purified GST-ShcD-SH2 and GST-ShcD-SH2* fusion proteins were used to precipitate transfected autoactive Tie2 from HEK293T lysate. GST alone and GST-ShcA-SH2 were used as negative and positive controls, respectively. IB: Immunoblot.
To further verify this association in the context of full-length ShcD, we introduced Flag-tagged wild-type ShcD (ShcD-WT) together with wild-type Tie2 (Tie2-WT) into HEK293T cells. In parallel, Tie2 was co-expressed with a panel of domain-specific ShcD variants with mutations in the PTB and/or SH2 domains which disrupt phosphotyrosine binding: PTB* (R315Q), SH2* (R549K) and PTB*/SH2* (P*/S*). Tie2 strongly co-immunoprecipitated with ShcD-WT, and this interaction was decreased more with the SH2* mutation than with the PTB* mutation (Fig. 2A). Next, we examined the role of Tie2 phosphorylation in ShcD binding, using a kinase-dead (KD, K853A) Tie2, and three variants which harbour tyrosine-to-phenylalanine mutations in C-terminal docking sites (Y1100F, Y1106F, and Y1111F). Phosphorylation on Tie2 was essential for ShcD interaction, and co-immunoprecipitation of Tie2 with ShcD was reduced via mutation of either Y1100 or Y1106 on Tie2 (Fig. 2B). Mutation of Y1111 appeared to increase ShcD binding, consistent with the enhanced kinase activity associated with this Tie2 variant (41). Lastly, we investigated the impact of ShcD and Tie2 co-expression on their respective phosphorylation using select mutant variants identified above, along with site-specific antibodies. Compared to expression of Tie2 alone, elevated levels of Tie2 phosphorylation on Y992 in the activation loop of the kinase domain were detected in the presence of ShcD-WT, and this effect was lost with the P*/S* mutation (Fig. 2C). Expression of ShcD with kinase inactive Tie2 did not promote Tie2 phosphorylation, indicating the requirement for intrinsic Tie2 kinase activity in ShcD-mediated receptor hyperphosphorylation. We also determined that ShcD was phosphorylated by Tie2 on the central Y374/Y375 residues, corresponding to Y239/Y240 residues in ShcA detected by pShc antibody (40), and that ShcD binding to phosphorylated Tie2 was required for this effect, as evidenced by the decrease in pShc with the P*/S* mutation (Fig. 2C). Collectively these findings define a phosphorylation-dependent interaction between ShcD and Tie2 and demonstrate that ShcD induces hyperphosphorylation of Tie2.
Figure 2: ShcD interacts with the C-terminal tail of Tie2 and promotes its hyperphosphorylation.

(A) Lysates from HEK293T cells transiently co-expressing Flag-tagged wild-type ShcD (ShcD-WT) or its point-mutated domain variants (PTB*, SH2*, and PTB*/SH2* labelled as P*/S*), along with wild-type Tie2 (Tie2-WT) were immunoprecipitated with anti-Flag antibody and immunoblotted for Flag (ShcD) and Tie2. Interaction between ShcD and Tie2 is reduced with mutation of the SH2 domain as well as the PTB domain. (B) Lysates from HEK293T cells transiently co-expressing ShcD-WT with Tie2-WT, its kinase-dead (KD) variant or tyrosine-to-phenylalanine mutations (Y1100F, Y1106F, and Y1111F) were immunoprecipitated with Flag antibody and immunoblotted for Flag (ShcD) and Tie2. Tie2 kinase activity is required for ShcD binding along with Y1100 and Y1106 in the C-terminal tail of the receptor. (C) ShcD and Tie2 variants from above were co-expressed in HEK293T cells to evaluate their potential to induce phosphorylation of either protein using phospho-specific antibodies. ShcD-WT is phosphorylated by Tie2-WT, but not by the Tie2-KD variant, and this effect is reduced with the ShcD-PTB*/SH2* domain mutant. Tie2 phosphorylation is increased in the presence of ShcD-WT but not ShcD-PTB*/SH2*. IP: Immunoprecipitation; IB: Immunoblot.
Wild-type ShcD and Tie2 synergistically promote invasion in U87 glioma cells through increased invadopodium formation and degradation of the ECM.
To explore the phenotypic effects of ShcD-Tie2 interaction, we used the well-characterized malignant glioma-derived cell lines U87 and T98G, which express no or low levels of endogenous ShcD and Tie2 (Fig. S2A,B). We first generated stable U87 glioma cells representing five different conditions: (i) control cells expressing neither ShcD nor Tie2 (Control; pcDNA3-Flag empty vector); (ii) cells expressing wild-type ShcD alone (ShcD-WT); (iii) cells expressing wild-type Tie2 alone (Tie2-WT), (iv) cells expressing both wild-type ShcD and Tie2 (ShcD-WT + Tie2-WT), and (v) cells expressing the ShcD-PTB*/SH2* mutation with wild-type Tie2 (ShcD-P*/S* + Tie2-WT), as confirmed by Western blot (Fig. 3A). The ability of these cells to invade was then assayed over 20 hrs using Matrigel™ invasion chambers. Cells expressing ShcD-WT or Tie2-WT alone showed a slight yet non-significant increase in invasion compared to controls, while cells expressing wild-type ShcD and Tie2 displayed a significant ~2.5-fold increase in invasion (Fig. 3B), suggesting a synergistic effect of the proteins in promoting invasion. This effect was lost in cells expressing the mutant ShcD which cannot bind or hyperphosphorylate Tie2. To rule out the possibility that this enhanced invasive potential was simply due to increased proliferation of the cells, we performed a WST-1 proliferation assay over the same timecourse and found no significant differences in growth rates in any of the cell lines (Fig. 3C). We then repeated these experiments in T98G cells expressing wild-type ShcD and/or Tie2 (and Control) (Fig. S3A). ShcD alone produced a significant mean 3.4-fold increase in invasion compared to control cells (Fig. S3B), and co-expression of ShcD enhanced the invasive potential of Tie2, although this was lower overall than ShcD alone in these cells with no changes in proliferation rates (Fig. S3C).
Figure 3: Stable U87 cells expressing both wild-type ShcD and Tie2 show increased invasive potential.

(A) Western blot showing expression levels of ShcD and Tie2 proteins in stable U87 cells. (B) Stable cell lines were subjected to Transwell invasion assays using Matrigel™. Cells invaded toward 10% FBS for 20 hrs and were then fixed and stained with crystal violet. Values are presented as percent of control. U87 cells expressing both ShcD-WT and Tie2-WT showed a significant increase in invasion compared to control and those expressing either protein alone or ShcD-P*/S* + Tie2-WT. (C) WST-1 assay over 24 hrs showing comparable proliferation rates of all five stable cell lines. n = 6 biological replicates for Control (pCDNA3-Flag) and ShcD-WT + Tie2-WT cells; n = 3 for ShcD-WT, Tie2-WT, and ShcD-P*/S* + Tie2-WT cells; IB: Immunoblot; P-values indicate significance levels from Kruskal-Wallis ANOVA followed by Tukey’s HSD test and only significant differences are shown ; *** P < 0.001; **** P < 0.0001.
We next sought to investigate whether the enhanced invasion in cells expressing both wild-type ShcD and wild-type Tie2 would translate to changes at the level of invadopodia in the U87 cell line. The ability of the cell lines to form invadopodia and degrade ECM was analyzed by plating cells onto fluorescent gelatin for 4 hrs or 24 hrs, respectively. Indeed, relative to control, a significantly larger percentage of cells expressing ShcD alone, Tie2 alone, or both proteins together were found to form invadopodia (Fig. 4A). Intriguingly however, only cells expressing the combination of ShcD and Tie2 resulted in a robust and significant increase in matrix degradation compared to control cells, while cells expressing either ShcD or Tie2 alone showed an enhanced but highly variable response (Fig. 4B). Lastly, using confocal microscopy, we confirmed that both Tie2 and ShcD localized to phalloidin-positive F-actin punctae, which were associated with regions of degraded gelatin (Fig. 4C), and that punctae co-localized with the invadopodia marker TKS5 (42) (Fig. S4). Together, these findings suggest that ShcD synergizes with the Tie2 RTK to regulate invadopodia-mediated invasion of U87 cells.
Figure 4: Stable U87 cells expressing both wild-type ShcD and Tie2 show increased invadopodium formation and matrix degradation.
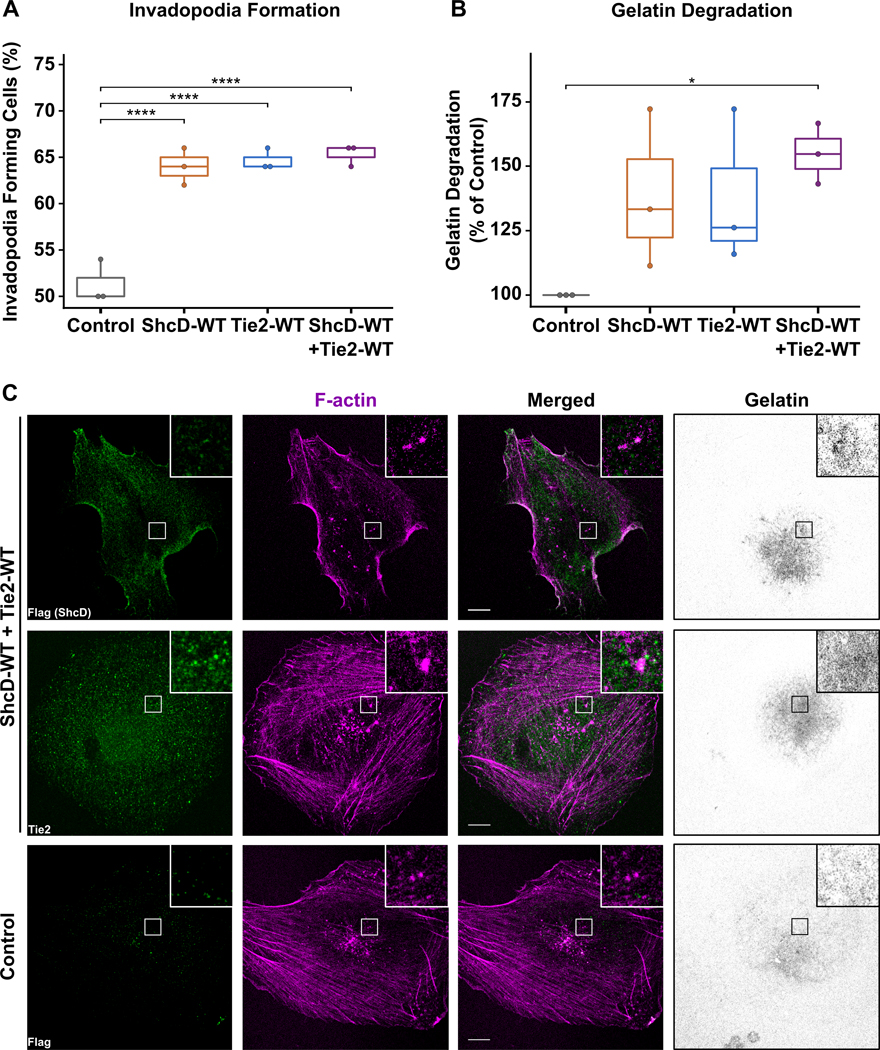
(A) Boxplots showing cells expressing ShcD and/or Tie2 had significantly higher numbers of cells forming invadopodia relative to control; n = 3 biological replicates. (B) Cells expressing both proteins were able to significantly degrade gelatin compared to control or cells expressing either protein alone; n = 3. (C) Coverslips from 24hrs were stained with Flag (ShcD, green) or Tie2 (green) along with Phalloidin (F-actin, magenta), and analyzed by confocal microscopy to determine protein localization; P-values indicate significance levels from Kruskal-Wallis ANOVA followed by Tukey’s HSD test and only significant differences are shown; * P < 0.05; **** P < 0.001. Scale bar: 10 μm.
U87-derived tumor spheroids co-expressing ShcD and Tie2 show high propensity to infiltrate human cerebral organoids.
GBM cells use their intrinsic migratory ability to penetrate brain tissues; consequently, we proceeded to investigate whether the functional consequences of ShcD-Tie2 synergy persist in a three-dimensional (3D) setting. First, U87 cells expressing wild-type ShcD and/or Tie2 along with control cells were induced to aggregate into tumor spheroids and then seeded onto gelatin-coated plates where they could attach and out-migrate. Unexpectedly, cell migration away from the spheroid’s edge over a period of 72 hrs was not significantly different between the four cell lines with this assay (Fig. S5A). Considering this negative result, we speculated that the lack of a more complex 3D microenvironment in which tumor cells can penetrate possibly masked the effect of ShcD and Tie2 co-expression. We then repeated the experiment with human cerebral organoids derived from induced pluripotent stem cells (iPSCs) as an invasion substrate - a model that more closely recapitulates brain-tumor interaction and allows deep infiltration and proliferation of GBM cells (43,44) (Fig. 5A). To this end, U87 cells expressing wild-type ShcD and/or Tie2 were stably transduced with enhanced green fluorescent protein (EGFP), prepared as spheroids and then co-cultured with mature cerebral organoids. Specimens were fixed, and low magnification brightfield/fluorescence captures were taken before freezing and cryosectioning at early (3 days) and late (17 days) stages (Fig. 5B). Examination of low-magnification images from the 3-day timepoint clearly showed attachment between cerebral organoids and spheroids from all four cell lines, and GFP-positive cells were observed migrating along the surface of the brain-like model, particularly in ShcD and/or Tie2 expressing samples compared to control (Fig. S5B). Following 17 days of co-culture, GFP-positive tumor cells had completely surrounded their respective organoids (Fig. 5C, S5C). Immunostaining of sections using Tuj1 (neuronal marker) revealed a clear interface between the organoid and tumor spheroids expressing either wild-type ShcD or Tie2 alone similar to control, which was no longer discernible in spheroids expressing both ShcD and Tie2 (Fig. 5C). Indeed, inspection of high magnification images following immunostaining with Tuj1 (Fig. 5D) or Nestin (neuronal marker) (Fig. 5E) highlighted the deep infiltration of ShcD+Tie2-expressing tumor cells as well as the intertwined nature of neurons from the organoid with spheroid-derived tumor cells. Measurement of tumor cell invasion area towards the center of the organoid showed that while ShcD alone produced a slight increase in invading cells, ShcD+Tie2-expressing spheroid cells invaded up to ~22 times the area on average relative to control cells (Fig. 5F). Overall, these findings suggest that co-expression of wild-type ShcD and Tie2 allows tumor cells to acquire an invasive phenotype to drive glioma progression.
Figure 5: Stable GBM cells expressing both wild-type ShcD and Tie2 show increased infiltration into cerebral organoids.

(A) Schematic illustration of the co-culture model, with arrow depicting invasion of GFP-positive tumor cells into the organoid. (B) Whole mount images showing U87 spheroids (green) in co-culture with cerebral organoids (black). Spheroids are loosely attached to the organoids on day = 3 and have fully engulfed the organoid surface by day = 17. (C) Representative immunofluorescence images from cross-sections showing the interface of GFP-positive tumor cells (green) with Tuj1-positive organoids (red). (D) Higher magnification images from Fig. S5C showing deep infiltration of ShcD/Tie2 expressing U87 cells (green, highlighted with arrows). (E) Adjacent sections from the same organoid specimens stained for Nestin showing co-localization of tumor cells (green) with neurons (red) (yellow in merged panels, indicated with arrows). (F) Quantification of spheroid invasion at day = 17 by measuring the percentage co-localized area of GFP-positive invading GBM cells and Tuj1-positive cells. Tumor cells expressing both wild-type ShcD and Tie2 invade ~22 times further on average compared to control (n = 12 for Control, and ShcD-WT+Tie2-WT, n = 7 for ShcD-WT, and n = 8 for Tie2-WT organoids); **** P < 0.0001. P-values indicate significance levels from Kruskal-Wallis ANOVA followed by Tukey’s HSD test and only significant differences are shown. Scale bar: 500 μm.
ShcD and Tie2 co-expression is associated with dephosphorylation of focal adhesion kinase.
In order to probe the signaling consequences downstream of ShcD-Tie2 interaction in glioma cells, we assessed activation of FAK and Src – two key kinases downstream of RTKs known to regulate invasion and metastasis. We first confirmed that stimulation with Tie2 activating ligand Ang-1 induced phosphorylation of Tie2 in U87 cells (Fig. 6A), and that ShcD-mediated hyperphosphorylation of Tie2 could be observed in glioma cells co-expressing both proteins (Fig. 6B). Next, we observed that there was substantial dephosphorylation of FAK at Y397 site in cells expressing wild-type ShcD and/or Tie2 compared to unstimulated cells (Fig. 6C). Densitometric quantitation of FAK phosphorylation (pFAK) compared to total expression levels confirmed the decrease was most significant in cells expressing both ShcD and Tie2, and that expression of Tie2 alone also induced a significant decrease in pFAK, while expression of ShcD alone induced a modest yet non-significant decrease in pFAK compared to control (Fig. 6D). By contrast, we noted an increase in Src dephosphorylation on Y527 in cells overexpressing ShcD and/or Tie2, which is concomitant with Src activation, but this did not reach significance when compared to total Src levels (Fig. 6E). These findings implicate changes in regulation of FAK and Src activity via Tie2 and ShcD signaling.
Figure 6: ShcD and Tie2 co-expression is associated with dephosphorylation of the focal adhesion kinase.

(A) U87 stable cells expressing wild-type Tie2 alone were stimulated with Ang-1 for 0, 5, 10, and 20 mins respectively. Highest levels of Tie2 phosphorylation were achieved with a 20-min stimulation with 100ng/mL of Ang-1. (B) Western blot showing increased phosphorylation of Tie2 in presence of wild-type ShcD in U87 cells when treated with 100ng/mL of Ang-1. (C) U87 stable cell lines expressing wild-type ShcD, wild-type Tie2 or both (and Control) stimulated with Ang-1 for 20 mins showing lower pFAK levels in the presence of both ShcD and Tie2 compared to either ShcD or Tie2 alone, or vector control cells. (D) Densitometry analysis revealed suppression of FAK activation in cells expressing both ShcD-WT and Tie2-WT to be significantly higher compared to control, and Tie2-WT alone (but not ShcD-WT alone) also produced a significant decrease in pFAK. (E) An opposite activation profile was observed for Src where non-pSrc (active Src) appeared to increase in cells co-expressing ShcD and Tie2; * P < 0.05; ** P < 0.01; n = 3 biological replicates. P-values indicate significance levels from Kruskal-Wallis ANOVA followed by Tukey’s HSD test. IP: Immunoprecipitation; IB: Immunoblot.
ShcD mRNA upregulation is correlated with components of Tie2 signaling and EMT as well as decreased patient survival in gliomas.
Lastly, to further explore potential molecular mechanisms underlying ShcD-mediated glioma cell invasion, we investigated TCGA and CGGA datasets to compare mRNA levels of ShcD with regulators of Tie2 signaling and cancer cell invasion. We noted significant positive correlations of ShcD with Tie2, Ang-1 and the alternate Tie2 ligand Angiopoietin-2 (Ang-2/ANGPT2) in tumors representing G3 and G4 (Fig. 7A-D) as well as G2 (Fig. S6A,B), most notably within the CGGA_693 dataset compared to the TCGA dataset. Correlations with mesenchymal marker N-cadherin (CDH2) were generally higher than epithelial marker E-cadherin (CDH1), in line with the role of ShcD in promoting an invasive phenotype. Furthermore, we noted that elevated ShcD mRNA expression correlated with poor patient outcome in G3 in both datasets. Specifically, high ShcD corresponded to a significant reduction in median overall survival of 43.35% in the TCGA dataset (HRG3 = 2.31; P = 4.9E-04; Fig. 7E), and 47.79% in the CGGA_693 dataset (HRG3 = 1.68; P = 2.7E-03; Fig. 7G). ShcD expression levels did not alter survival rates in G2 (Fig. S6A,B) or G4 (Fig. 7F,H) glioma patients. Investigation of GBM subtype-specific correlation patterns further highlighted positive correlations of ShcD with Tie2, Ang-1, and Ang-2, most notably in classical and mesenchymal subtypes (Fig. 7I-L), as well as in proneural (Fig. S6E,F) but not neural (Fig. S6I). Increased ShcD levels also corresponded to a significant 20.1% reduction in median overall survival in mesenchymal subtype in the TCGA dataset (HRME = 2.95; P = 0.003) (Fig. 7N). ShcD expression levels did not correlate with survival in other subtypes (Fig. 7M,O,P, and Fig. S6G,H,J). While correlations with ShcD were generally weaker in the TCGA dataset (Fig. 7A,B and Fig. S6A), significant positive correlations of ShcD with Tie2, Ang-1 and the alternate Tie2 ligand Angiopoietin-2 (ANGPT2) as well as N-cadherin were observed in the CGGA_693 dataset in tumors representing G2 (Fig. S6B), G3 (Fig. 7C), and G4 (Fig. 7D).
Figure 7: ShcD mRNA expression is positively correlated with components of Tie2 signaling, EMT markers and reduced survival in advanced gliomas of classical and mesenchymal subtype.

(A-D) Correlation analysis of ShcD mRNA expression with components of the Tie2 signaling pathway and EMT markers in relation to Grades 3 and 4, and classical and mesenchymal subtypes of GBM (I-L) in TCGA (left) and CGGA_693 (right) datasets respectively. Lower triangles represent Pearson’s correlation coefficients. Upper triangles represent P-values indicating significance of correlation for each pair. The size of shaded squares is inversely proportional to P-values and is also indicated with * where significant. (E-H) Analysis of overall survival over a 10-year period for patients with high (solid line) or low levels (dotted line) of ShcD expression in relation to Grades 3 and 4, and classical and mesenchymal subtypes of GBM (M-P) in TCGA and CGGA_693 datasets respectively. Numbers under survival curve denote the number of patients who are at risk of death in the two groups. G3: Grade 3; G4: Grade 4; P-values indicate significance levels from Kruskal-Wallis ANOVA followed by Tukey’s HSD test and only significant differences are shown; * P < 0.05; ** P < 0.01; *** P < 0.001.
Further investigation of GBM subtype-specific correlation patterns in both datasets highlighted a moderate positive correlation between ShcD with Tie2, Ang-1 and Ang-2, which was particularly strong in classical samples in the CGGA_693 dataset (Fig. 7K,L) compared to the TCGA dataset (Fig. 7I,J). Since mesenchymal subtype is characterized as more invasive compared to others, we assessed correlation of ShcD with key genes associated with EMT. Accordingly, ShcD showed a moderate positive correlation with the mesenchymal marker N-cadherin (CDH2) in different glioma grades (Fig. 7A,B) and GBM subtypes (Fig. 7I,J), with the highest correlation observed specifically in mesenchymal subtype tumors in the TCGA dataset. By contrast, weak negative correlations were observed between ShcD and the epithelial marker E-cadherin (CDH1) in different glioma grades and GBM subtypes in the TCGA dataset, but these did not reach significance (Fig. 7A,B,I,J). In the CGGA_693 dataset, correlation between ShcD and N-cadherin was lower in mesenchymal samples (Fig. 7L) compared to that in classical subtype samples (Fig. 7K) in the CGGA_693 dataset. Interestingly however, no significant differences were observed in survival rates relative to ShcD expression in either subtype in the CGGA_693 dataset (Fig. 7O,P). Correlation analysis of ShcD and Tie2 and its signaling components as well as E- and N-cadherin genes across low-grade (G2), proneural and neural subtypes in the TCGA dataset did not reveal significantly strong correlations (Fig. S6A,E,I) but they were strongly positively correlated in the CGGA_693 dataset (Fig. S6B,F). However, no significant differences in survival rates were observed for patients expressing different levels of ShcD in either dataset (Fig. S6C,D,G,H,J). Few correlations with these genes or survival outcomes were observed in the CGGA_325 dataset (Fig. S7A-L), likely owing to the small sample size. Altogether our results support a potential clinical involvement of ShcD in Tie2 signaling and advanced gliomas.
DISCUSSION
Here we have demonstrated that adaptor protein ShcD binds the Tie2 receptor and promotes its hyperphosphorylation. Furthermore, we have shown that the two proteins synergize and foster an invasive phenotype in U87 glioma cells characterized by formation of invadopodia and enhanced degradation of ECM, infiltration of human cerebral organoids and Ang-1 dependent changes in FAK activation. In addition to verifying upregulation of ShcD mRNA expression in advanced and invasive gliomas, we have determined that high ShcD levels correlate with poor patient outcome. We also found that ShcD levels positively correlated with components of Tie2 signaling, as well as markers of EMT. Together, our data portray ShcD as a novel molecular effector of glioma progression which may have clinical applications.
The unique modular domain organization of Shc proteins suggests that they function in proximity to RTKs and their binding partners. Previous studies have shown that ShcA interacts with Tie2 via its SH2 domain (17), and our studies now extend this analysis to show that both the SH2 and PTB domains of ShcD contribute to Tie2 binding. Despite the absence of a canonical PTB domain-binding motif (NPxY) in Tie2, some proteins with PTB domains like Dok2 have been shown to bind to a Tie2 autophosphorylation site, Y1106, located in the cytoplasmic tail (45). Indeed, we found reduced co-immunoprecipitation of ShcD with the Tie2 Y1106F substitution variant, as well as with Y1100F, which conforms to a Shc SH2 domain consensus binding motif (46). By contrast, we noted increased co-immunoprecipitation with the Y1111F variant. Y1111 has previously been shown to serve as a negative regulatory site (15,47); mutating this residue results in enhanced receptor phosphorylation and kinase activity (41). Interaction between ShcD and Tie2 results in receptor hyperphosphorylation, similar to our previous findings with ShcD and EGFR (10). Hyperphosphorylation of Tie2 appears to correlate with its intrinsic hyperactivation, as evidenced by increased phosphorylation on the key tyrosine residue within the kinase activation loop as well as the reciprocal downstream increase in ShcD phosphorylation. This effect is unprecedented among Shc proteins, though there are reports of other SH2 domain-containing proteins enhancing phosphorylation of their target RTKs through phosphosite protection (48,49). Upregulation of ShcD and its consequent effects on RTK activation may therefore increase steady-state signaling and promote oncogenic cell-based changes.
In glioma, misregulation of RTK signaling manifests as hallmark alterations in cell migration and invasion. Consistent with the effect of ShcD on Tie2 phosphorylation, we found that U87 glioma cells stably expressing wild-type ShcD along with Tie2 had significantly enhanced transwell invasion compared to control cells or cells expressing either protein alone and this was not due to enhanced proliferation. Notably, this effect on invasion was not seen in the presence of a ShcD mutant which cannot bind Tie2 or induce its hyperphosphorylation. In the T98G cell line, ShcD alone produced a significant increase in invasion, and while ShcD enhanced the invasive potential of Tie2, it was not as robust as ShcD alone. As T98G cells express low levels of ShcD but not Tie2 (unlike U87 cells), we speculate that these cells may possess an alternate ShcD-mediated signaling pathway to drive invasion that is co-opted in the presence of Tie2. To further strengthen the role of ShcD and Tie2 expression in cell invasion, future studies will use a complementary loss-of-function approach (knockdown or knockout) in glioma cells with high expression of ShcD and Tie2, and determine whether it mitigates invasive potential.
Intriguingly, while U87 cells expressing wild-type ShcD and/or Tie2 all displayed significantly more invadopodia compared to control, only cells expressing both proteins showed a persistent increase in matrix degradation. The synergistic effect of ShcD and Tie2 on invasion was similarly observed in glioma cell-derived spheroids co-cultured with cerebral organoids. We hypothesize that hyperactivation of Tie2 signaling by ShcD may promote an invasive response by inducing threshold levels of proteolytic activity in invadopodia. The function of invadopodia is regulated by precise localization of matrix metalloproteinases (MMPs) including MMP2, MMP9 and MMP14 (also called MT1-MMP) (5), as well as integrins and growth factor receptors. Our previous studies in endothelial cells have shown that overexpression of Tie2 in mice leads to increased activity of MMP2 and MMP9 (50). As well, in line with the finding that ß1-integrin is required for invadopodia-mediated ECM degradation and cell invasion (51), invasive glioma cells expressing Tie2 show increased ß1-integrin surface expression (18,52). Altogether, upregulation of ShcD may provide a mechanism to lower the requirement for endogenous Tie2 agonists, which could activate receptor signaling and drive invasion in a cellular environment primed with assembled invadopodia precursors.
Invadopodia formation requires signaling through adhesion proteins such as integrins, FAK, and Src (5). Although FAK is not recruited into invadopodia, it has been shown to negatively regulate their formation and maturation by sequestering Src at focal adhesions. In both MTLn3 breast cancer cells (52) and B16F10 melanoma cells (53), it is proposed that dephosphorylation of FAK releases Src, which then localizes to invadopodia where it phosphorylates scaffold proteins such as TKS5, leading to formation of invadopodia. Furthermore, in A431 epidermoid carcinoma cells, EGF-induced FAK dephosphorylation induced morphological changes, cell detachment, and increased invasion and metastasis which could be reversed through activation of integrin signaling (54). Here, in line with the reports above, we found that U87 glioma cells expressing both ShcD and Tie2 show an inverse relationship between FAK dephosphorylation and Src activation following Ang-1 stimulation, and these effects were dampened in cells expressing Tie2 alone. These results further support the notion that the presence of ShcD enables primed cells to overcome a signaling threshold which potently promotes invasion and matrix degradation.
Intra- and intertumoral heterogeneity in GBM has long delayed therapeutic progress. Genomic profiling of GBM tumors has revealed multiple subtypes, each with distinct gene expression patterns (39). These consist of classical, mesenchymal and proneural subtypes, with emerging evidence suggesting that the neural subtype may not be tumor-specific, likely resulting from contaminating normal cells surrounding the tumor (55,56). Analysis of public genomic datasets showed significant ShcD upregulation in the classical (proliferative) subtype defined by EGFR amplification compared to mesenchymal and proneural subtypes. Our previous observation that ShcD can induce hyperphosphorylation of EGFR (10) provides a parallel mechanism to activate this critical RTK. Interestingly however, mesenchymal subtype is the most invasive and despite overall lower levels of ShcD in this subtype compared to classical, patients expressing higher ShcD levels had significantly lower survival rates in the TCGA cohort. Additionally, because invading cells principally undergo an epithelial to mesenchymal shift characterized by loss of E-cadherin and gain of N-cadherin, we assessed the correlation of the two genes with ShcD mRNA expression and found a significant positive correlation between ShcD and N-cadherin under multiple data subsets. Similarly, we noted strong positive correlations of ShcD with Tie2, Ang-1 and Ang-2, the latter of which was consistently found across multiple tumor grades and subtypes in both TCGA and CGGA cohorts. Ang-2 functions as a context-dependent Tie2 agonist (57,58) and it is overexpressed in numerous cancers, including gliomas, where it has been shown to promote invasion through activation of MMP2 (59,60). Additionally, Ang-2 has been shown to act as a chemoattractant for Tie2-expressing macrophages, which drive tumor vessel formation and metastasis (61), and Ang-2 levels are increased in glioma following anti-angiogenic therapy, leading to invasive glioma recurrence (62). Targeting of Ang-2/Tie2 signaling has been shown to inhibit tumor growth and invasion in several cancers including glioma (20) and mammary tumors (20,63). Although single-cell transcriptional profiles will be necessary to robustly link invasion behavior in cells representing different subtypes with specific levels of ShcD expression and/or Tie2 signaling, our results herein highlight a molecular mechanism to support the potential involvement of ShcD in poor outcome GBM.
In summary, our findings identify a novel synergistic association of ShcD and Tie2 which promotes an invasive phenotype and provide mechanistic insights into invadopodia dynamics in glioma cells. Upregulation of ShcD in aggressive gliomas and its association with decreased survival in G3 gliomas underscores its potential as a prognostic marker and future therapeutic target.
Supplementary Material
Implications:
ShcD cooperates with Tie2 to promote glioma cell invasion and its elevated expression correlates with poor patient outcome in advanced gliomas.
ACKNOWLEDGEMENTS
We thank Dr. Brenda Coomber for reagents, Dr. Jim Uniacke for microscopy resources, and Qi Wu for technical assistance. The results presented here are in part based upon data generated by the TCGA Research Network: https://www.cancer.gov/tcga.
This work was supported by an NSERC Discovery Grant (RGPIN 461433-2017), NSERC Discovery Accelerator Supplement (RGPAS 246418-2017) and Tier 2 Canada Research Chair (all to N.J.), as well as generous start-up funding from the University of Guelph to J.L., and Cancer Research Society grant to M.G.C. R.H.P and S.D.S were supported by NIH funding (NIMH 1R01MH120227-01) to R.H.P. M.T. received a College of Biological Sciences (CBS) Studentship, and S.E.W. received a CBS Graduate Tuition Scholarship.
Footnotes
Conflict of interest: The authors declare no potential conflicts of interest.
REFERENCES
- 1.Chen R, Smith-Cohn M, Cohen AL, Colman H. Glioma Subclassifications and Their Clinical Significance. Neurotherapeutics. 2017;14(2):284–97. [DOI] [PMC free article] [PubMed] [Google Scholar]
- 2.Louis DN, Perry A, Reifenberger G, von Deimling A, Figarella-Branger D, Cavenee WK, et al. The 2016 World Health Organization Classification of Tumors of the Central Nervous System: a summary. Acta Neuropathol. 2016;131(6):803–20. [DOI] [PubMed] [Google Scholar]
- 3.Meyer MA. Malignant Gliomas in Adults. N Engl J Med. 2008;359(17):1850–1850. [DOI] [PubMed] [Google Scholar]
- 4.Berens ME, Giese A. “. . . those left behind.” Biology and Oncology of Invasive Glioma Cells. Neoplasia. 1999;1(3):208–19. [DOI] [PMC free article] [PubMed] [Google Scholar]
- 5.Eddy RJ, Weidmann MD, Sharma VP, Condeelis JS. Tumor Cell Invadopodia: Invasive Protrusions that Orchestrate Metastasis. Trends Cell Biol. 2017;27(8):595–607. [DOI] [PMC free article] [PubMed] [Google Scholar]
- 6.Mitra SK, Schlaepfer DD. Integrin-regulated FAK-Src signaling in normal and cancer cells. Curr Opin Cell Biol. 2006;18(5):516–23. [DOI] [PubMed] [Google Scholar]
- 7.Whitehead CA, Nguyen HPT, Morokoff AP, Luwor RB, Paradiso L, Kaye AH, et al. Inhibition of Radiation and Temozolomide-Induced Invadopodia Activity in Glioma Cells Using FDA-Approved Drugs. Transl Oncol. 2018;11(6):1406–18. [DOI] [PMC free article] [PubMed] [Google Scholar]
- 8.Wills MKB, Jones N. Teaching an old dogma new tricks: Twenty years of Shc adaptor signalling. Biochem J. 2012;447(1):1–16. [DOI] [PubMed] [Google Scholar]
- 9.Fagiani E, Giardina G, Luzi L, Cesaroni M, Quarto M, Capra M, et al. RaLP, a new member of the Src homology and collagen family, regulates cell migration and tumor growth of metastatic melanomas. Cancer Res. 2007;67(7):3064–73. [DOI] [PubMed] [Google Scholar]
- 10.Wills MKB, Tong J, Tremblay SL, Moran MF, Jones N. The ShcD signaling adaptor facilitates ligand-independent phosphorylation of the EGF receptor. Mol Biol Cell. 2014;25(6):739–52. [DOI] [PMC free article] [PubMed] [Google Scholar]
- 11.Dumont DJ, Yamaguchi TP, Conlon RA, Rossant J, Breitman ML. Tek, a novel tyrosine kinase gene located on mouse chromosome 4, is expressed in endothelial cells and their presumptive precursors. Oncogene. 1992;7(8):1471–80. [PubMed] [Google Scholar]
- 12.Woo SM, Ho SP, Ki HY, Kyu YJ, Myoung JK, Park H, et al. Expression of angiopoietin 1, 2 and their common receptor Tie2 in human gastric carcinoma: Implication for angiogenesis. J Korean Med Sci. 2006;21(2):272–8. [DOI] [PMC free article] [PubMed] [Google Scholar]
- 13.Peters KG, Coogan A, Berry D, Marks J, Iglehart JD, Kontos CD, et al. Expression of Tie2/Tek in breast tumour vasculature provides a new marker for evaluation of tumour angiogenesis. Br J Cancer. 1998;77(1):51–6. [DOI] [PMC free article] [PubMed] [Google Scholar]
- 14.Zadeh G, Qian B, Okhowat A, Sabha N, Kontos CD, Guha A. Targeting the Tie2/Tek Receptor in Astrocytomas. Am J Pathol. 2004;164(2):467–76. [DOI] [PMC free article] [PubMed] [Google Scholar]
- 15.Jones N, Master Z, Jones J, Bouchard D, Gunji Y, Sasaki H, et al. Identification of Tek/Tie2 binding partners. Binding to a multifunctional docking site mediates cell survival and migration. J Biol Chem. 1999;274(43):30896–905. [DOI] [PubMed] [Google Scholar]
- 16.Jones N, Iljin K, Dumont DJ, Alitalo K. Tie receptors: New modulators of angiogenic and lymphangiogenic responses. Nat Rev Mol Cell Biol. 2001;2(4):257–67. [DOI] [PubMed] [Google Scholar]
- 17.Audero E, Cascone I, Maniero F, Napione L, Arese M, Lanfrancone L, et al. Adaptor ShcA Protein Binds Tyrosine Kinase Tie2 Receptor and Regulates Migration and Sprouting but Not Survival of Endothelial Cells. J Biol Chem. 2004;279(13):13224–33. [DOI] [PubMed] [Google Scholar]
- 18.Lee OH, Xu J, Fueyo J, Fuller GN, Aldape KD, Alonso MM, et al. Expression of the receptor tyrosine kinase Tie2 in neoplastic glial cells is associated with integrin β1-dependent adhesion to the extracellular matrix. Mol Cancer Res. 2006;4(12):915–26. [DOI] [PubMed] [Google Scholar]
- 19.Liu D, Martin V, Fueyo J, Lee OH, Xu J, Cortes-Santiago N, et al. Tie2/TEK modulates the interaction of glioma and brain tumor stem cells with endothelial cells and promotes an invasive phenotype. Oncotarget. 2010;1(8):700–9. [DOI] [PMC free article] [PubMed] [Google Scholar]
- 20.Cortes-Santiago N, Hossain MB, Gabrusiewicz K, Fan X, Gumin J, Marini FC, et al. Soluble Tie2 overrides the heightened invasion induced by anti-angiogenesis therapies in gliomas. Oncotarget. 2016;7(13):16146–57. [DOI] [PMC free article] [PubMed] [Google Scholar]
- 21.Jones N, Hardy WR, Friese MB, Jorgensen C, Smith MJ, Woody NM, et al. Analysis of a Shc Family Adaptor Protein, ShcD/Shc4, That Associates with Muscle-Specific Kinase. Mol Cell Biol. 2007;27(13):4759–73. [DOI] [PMC free article] [PubMed] [Google Scholar]
- 22.Zimmerman AJ, Hafez AK, Amoah SK, Rodriguez BA, Dell’Orco M, Lozano E, et al. A psychiatric disease-related circular RNA controls synaptic gene expression and cognition. Mol Psychiatry. 2020;25(11):2712–27. [DOI] [PMC free article] [PubMed] [Google Scholar]
- 23.Grossman RL, Heath AP, Ferretti V, Varmus HE, Lowy DR, Kibbe WA, et al. Toward a Shared Vision for Cancer Genomic Data. N Engl J Med. 2016;375(12):1109–12. [DOI] [PMC free article] [PubMed] [Google Scholar]
- 24.Colaprico A, Silva TC, Olsen C, Garofano L, Cava C, Garolini D, et al. TCGAbiolinks: An R/Bioconductor package for integrative analysis of TCGA data. Nucleic Acids Res. 2016;44(8):e71. [DOI] [PMC free article] [PubMed] [Google Scholar]
- 25.Robinson MD, McCarthy DJ, Smyth GK. edgeR: A Bioconductor package for differential expression analysis of digital gene expression data. Bioinformatics. 2009;26(1):139–40. [DOI] [PMC free article] [PubMed] [Google Scholar]
- 26.Ritchie ME, Phipson B, Wu D, Hu Y, Law CW, Shi W, et al. Limma powers differential expression analyses for RNA-sequencing and microarray studies. Nucleic Acids Res. 2015;43(7):e47. [DOI] [PMC free article] [PubMed] [Google Scholar]
- 27.Zhao Z, Meng F, Wang W, Wang Z, Zhang C, Jiang T. Comprehensive RNA-seq transcriptomic profiling in the malignant progression of gliomas. Sci Data. 2017;4:170024. [DOI] [PMC free article] [PubMed] [Google Scholar]
- 28.Kassambara A, Kosinski M, Biecek P. Package “survminer” Type Package Title Drawing Survival Curves using “ggplot2” [Internet]. version 0.4.3. 2020. Available from: https://cran.r-project.org/web/packages/survminer/survminer.pdf [Google Scholar]
- 29.Therneau T, Lumley T original S->R port. survival: Survival analysis including penalised likelihood [Internet]. R package version 2.36–5. 2011. Available from: http://cran.r-project.org/package=survival [Google Scholar]
- 30.Wei T, Simcoe V. RPackage “corrplot”: Visualization of a correlation matrix (Version 0.84). 2017; [Google Scholar]
- 31.Bateman A, Martin MJ, O’Donovan C, Magrane M, Apweiler R, Alpi E, et al. UniProt: A hub for protein information. Nucleic Acids Res. 2015;43(D1):D204–12. [DOI] [PMC free article] [PubMed] [Google Scholar]
- 32.Pitre S, Dehne F, Chan A, Cheetham J, Duong A, Emili A, et al. PIPE: A protein-protein interaction prediction engine based on the re-occurring short polypeptide sequences between known interacting protein pairs. BMC Bioinformatics. 2006;7(1):365. [DOI] [PMC free article] [PubMed] [Google Scholar]
- 33.Szklarczyk D, Gable AL, Lyon D, Junge A, Wyder S, Huerta-Cepas J, et al. STRING v11: Protein-protein association networks with increased coverage, supporting functional discovery in genome-wide experimental datasets. Nucleic Acids Res. 2019;47(D1):D607–13. [DOI] [PMC free article] [PubMed] [Google Scholar]
- 34.Szklarczyk D, Morris JH, Cook H, Kuhn M, Wyder S, Simonovic M, et al. The STRING database in 2017: Quality-controlled protein-protein association networks, made broadly accessible. Nucleic Acids Res. 2017;45(D1):D362–8. [DOI] [PMC free article] [PubMed] [Google Scholar]
- 35.Shannon P, Markiel A, Ozier O, Baliga NS, Wang JT, Ramage D, et al. Cytoscape: A software Environment for integrated models of biomolecular interaction networks. Genome Res. 2003;13(11):2498–504. [DOI] [PMC free article] [PubMed] [Google Scholar]
- 36.Doncheva NT, Morris JH, Gorodkin J, Jensen LJ. Cytoscape StringApp: Network Analysis and Visualization of Proteomics Data. J Proteome Res. 2019;18(2):623–32. [DOI] [PMC free article] [PubMed] [Google Scholar]
- 37.Gómez-Rubio V. ggplot2 - Elegant Graphics for Data Analysis (2nd Edition). J Stat Softw. 2017;77:3–5. [Google Scholar]
- 38.Kassambara Alboukadel. ggpubr: “ggplot2” Based Publication Ready Plots. R package version 0.4.0. R Packag version 018 [Internet]. 2020; Available from: https://cran.r-project.org/package=ggpubr [Google Scholar]
- 39.Verhaak RGW, Hoadley KA, Purdom E, Wang V, Qi Y, Wilkerson MD, et al. Integrated Genomic Analysis Identifies Clinically Relevant Subtypes of Glioblastoma Characterized by Abnormalities in PDGFRA, IDH1, EGFR, and NF1. Cancer Cell. 2010;17(1):98–110. [DOI] [PMC free article] [PubMed] [Google Scholar]
- 40.Wills MKB, Chahi AK, Lau HR, Tilak M, Guild BD, New LA, et al. Signaling adaptor ShcD suppresses extracellular signal-regulated kinase (Erk) phosphorylation distal to the Ret and Trk neurotrophic receptors. J Biol Chem. 2017;292(14):5748–59. [DOI] [PMC free article] [PubMed] [Google Scholar]
- 41.Sturk C, Kim H, Jones N, Dumont DJ. A negative regulatory role for Y1111 on the Tie-2 RTK. Cell Signal. 2010;22(4):676–83. [DOI] [PubMed] [Google Scholar]
- 42.Saini P, Courtneidge SA. Tks adaptor proteins at a glance. J Cell Sci. 2018;131(1):1–6. [DOI] [PMC free article] [PubMed] [Google Scholar]
- 43.Ogawa J, Pao GM, Shokhirev MN, Verma IM. Glioblastoma Model Using Human Cerebral Organoids. Cell Rep. 2018;23(4):1220–9. [DOI] [PMC free article] [PubMed] [Google Scholar]
- 44.Linkous A, Balamatsias D, Snuderl M, Edwards L, Miyaguchi K, Milner T, et al. Modeling Patient-Derived Glioblastoma with Cerebral Organoids. Cell Rep. 2019;26(12):3203–3211.e5. [DOI] [PMC free article] [PubMed] [Google Scholar]
- 45.Jones N, Chen SH, Sturk C, Master Z, Tran J, Kerbel RS, et al. A Unique Autophosphorylation Site on Tie2/Tek Mediates Dok-R Phosphotyrosine Binding Domain Binding and Function. Mol Cell Biol. 2003;23(8):2658–68. [DOI] [PMC free article] [PubMed] [Google Scholar]
- 46.Songyang Z, Shoelson SE, McGlade J, Olivier P, Pawson T, Bustelo XR, et al. Specific motifs recognized by the SH2 domains of Csk, 3BP2, fps/fes, GRB-2, HCP, SHC, Syk, and Vav. Mol Cell Biol. 1994;14(4):2777–85. [DOI] [PMC free article] [PubMed] [Google Scholar]
- 47.Shewchuk LM, Hassell AM, Ellis B, Holmes WD, Davis R, Horne EL, et al. Structure of the Tie2 RTK domain - Self-inhibition by the nucleotide binding loop, activation loop, and C-terminal tail. Structure. 2000;8(11):1105–13. [DOI] [PubMed] [Google Scholar]
- 48.New LA, Chahi AK, Jones N. Direct regulation of nephrin tyrosine phosphorylation by Nck adaptor proteins. J Biol Chem. 2013;288(3):1500–10. [DOI] [PMC free article] [PubMed] [Google Scholar]
- 49.Jadwin JA, Curran TG, Lafontaine AT, White FM, Mayer BJ. Src homology 2 domains enhance tyrosine phosphorylation in vivo by protecting binding sites in their target proteins from dephosphorylation. J Biol Chem. 2018;293(2):623–7. [DOI] [PMC free article] [PubMed] [Google Scholar]
- 50.Voskas D, Jones N, Van Slyke P, Sturk C, Chang W, Haninec A, et al. A cyclosporine-sensitive psoriasis-like disease produced in Tie2 transgenic mice. Am J Pathol. 2005;166(3):843–55. [DOI] [PMC free article] [PubMed] [Google Scholar]
- 51.Williams KC, Coppolino MG. SNARE-dependent interaction of Src, EGFR and ß1 integrin regulates invadopodia formation and tumor cell invasion. J Cell Sci. 2014;127(8):1712–25. [DOI] [PubMed] [Google Scholar]
- 52.Chan KT, Cortesio CL, Huttenlocher A. Fak alters invadopodia and focal adhesion composition and dynamics to regulate breast cancer invasion. J Cell Biol. 2009;185(2):357–70. [DOI] [PMC free article] [PubMed] [Google Scholar]
- 53.Kolli-Bouhafs K, Sick E, Noulet F, Gies JP, De Mey J, Rondé P. FAK competes for Src to promote migration against invasion in melanoma cells. Cell Death Dis. 2014;5(8):e1379. [DOI] [PMC free article] [PubMed] [Google Scholar]
- 54.Lu Z, Jiang G, Blume-Jensen P, Hunter T. Epidermal Growth Factor-Induced Tumor Cell Invasion and Metastasis Initiated by Dephosphorylation and Downregulation of Focal Adhesion Kinase. Mol Cell Biol. 2001;21(12):4016–31. [DOI] [PMC free article] [PubMed] [Google Scholar]
- 55.Sturm D, Witt H, Hovestadt V, Khuong-Quang DA, Jones DTW, Konermann C, et al. Hotspot Mutations in H3F3A and IDH1 Define Distinct Epigenetic and Biological Subgroups of Glioblastoma. Cancer Cell. 2012;22(4):425–37. [DOI] [PubMed] [Google Scholar]
- 56.Brennan CW, Verhaak RGW, McKenna A, Campos B, Noushmehr H, Salama SR, et al. The somatic genomic landscape of glioblastoma. Cell. 2013;155(2):462. [DOI] [PMC free article] [PubMed] [Google Scholar]
- 57.Teichert-Kuliszewska K, Maisonpierre PC, Jones N, Campbell AIM, Master Z, Bendeck MP, et al. Biological action of angiopoietin-2 in a fibrin matrix model of angiogenesis is associated with activation of Tie2. Cardiovasc Res. 2001;49(3):659–70. [DOI] [PubMed] [Google Scholar]
- 58.Daly C, Eichten A, Castanaro C, Pasnikowski E, Adler A, Lalani AS, et al. Angiopoietin-2 functions as a Tie2 agonist in tumor models, where it limits the effects of VEGF inhibition. Cancer Res. 2013;73(1):108–18. [DOI] [PubMed] [Google Scholar]
- 59.Hu B, Guo P, Fang Q, Tao HQ, Wang D, Nagane M, et al. Angiopoietin-2 induces human glioma invasion through the activation of matrix metalloprotease-2. Proc Natl Acad Sci U S A. 2003;100(15):8904–9. [DOI] [PMC free article] [PubMed] [Google Scholar]
- 60.Hu B, Jarzynka MJ, Guo P, Imanishi Y, Schlaepfer DD, Cheng SY. Angiopoietin 2 induces glioma cell invasion by stimulating matrix metalloprotease 2 expression through the αvβ1 integrin and focal adhesion kinase signaling pathway. Cancer Res. 2006;66(2):775–83. [DOI] [PMC free article] [PubMed] [Google Scholar]
- 61.De Palma M, Mazzieri R, Politi LS, Pucci F, Zonari E, Sitia G, et al. Tumor-Targeted Interferon-α Delivery by Tie2-Expressing Monocytes Inhibits Tumor Growth and Metastasis. Cancer Cell. 2008;14(4):299–311. [DOI] [PubMed] [Google Scholar]
- 62.Gabrusiewicz K, Liu D, Cortes-Santiago N, Hossain MB, Conrad CA, Aldape KD, et al. Anti-vascular endothelial growth factor therapy-induced glioma invasion is associated with accumulation of Tie2-expressing monocytes. Oncotarget. 2014;5(8):2208–20. [DOI] [PMC free article] [PubMed] [Google Scholar]
- 63.Mazzieri R, Pucci F, Moi D, Zonari E, Ranghetti A, Berti A, et al. Targeting the ANG2/TIE2 Axis Inhibits Tumor Growth and Metastasis by Impairing Angiogenesis and Disabling Rebounds of Proangiogenic Myeloid Cells. Cancer Cell. 2011;19(4):512–26. [DOI] [PubMed] [Google Scholar]
Associated Data
This section collects any data citations, data availability statements, or supplementary materials included in this article.