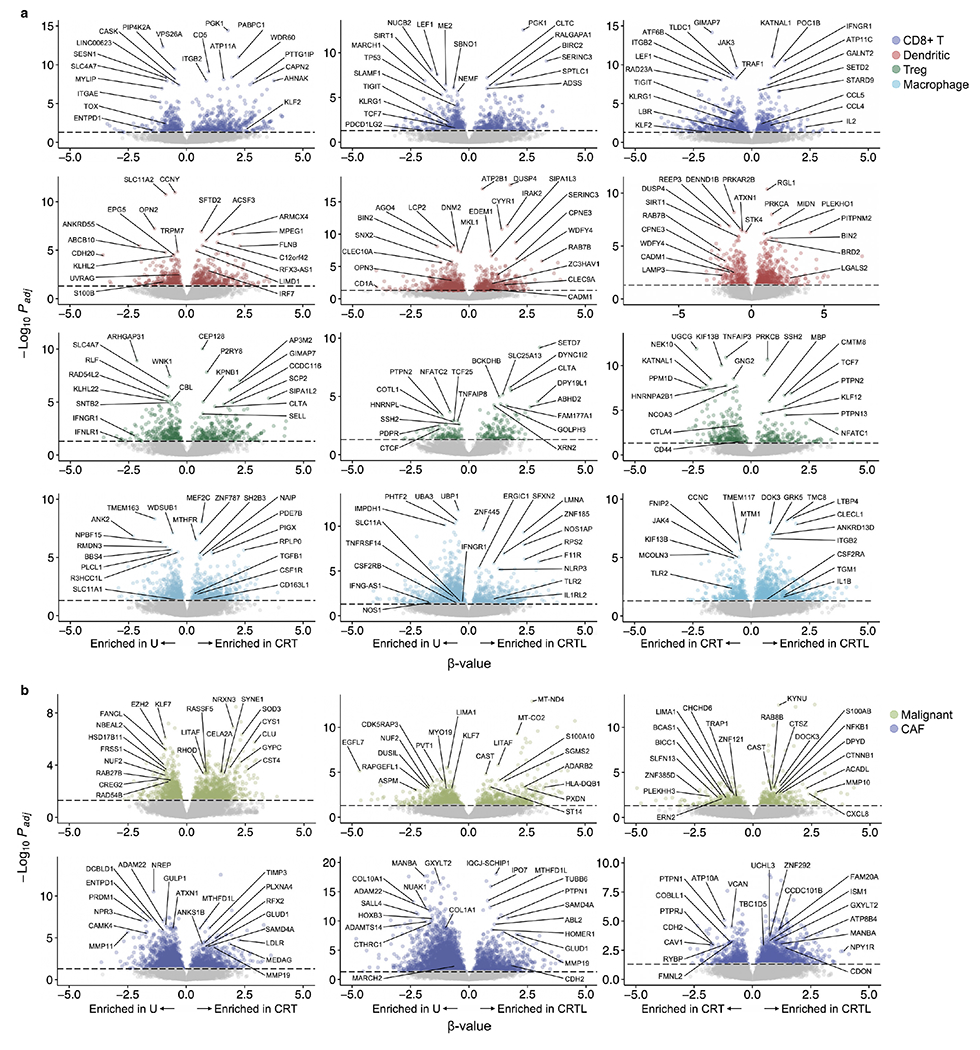
Extended Data Fig. 3 |. Impact of treatment on differential gene expression in immune cells, malignant cells, and cancer-associated fibroblasts.

a, Differential expression (β-value, x axis, Poisson mixed-effect linear regression model, lme4 R package) and its significance (−log10(adjusted p-value), y axis) for CD8+ T cells (top row), dendritic cells (second row), Tregs (third row) and macrophages (bottom row, color legend) in CRT vs. untreated (left), CRTL vs. untreated (middle), and CRTL vs. CRT (right) tumors. Selected enriched or depleted genes are labeled. Bonferroni adjusted p-value < 0.05 is indicated with a dotted horizontal line. b, Differential expression (β-value, x axis, Poisson mixed-effect linear regression model, lme4 R package) and its significance (−log10(adjusted p-value), y axis) for malignant cells (top row) and CAFs (bottom row, color legend) in CRT vs. untreated (left), CRTL vs. untreated (middle), and CRTL vs. CRT (right) tumors. Selected enriched or depleted genes are labeled. Bonferroni adjusted p-value < 0.05 is indicated with a dotted horizontal line.
