
Figure 5 |. The neural-like progenitor program is enriched in residual tumor and patient-derived organoids after cytotoxic therapy and is associated with poor clinical outcomes.
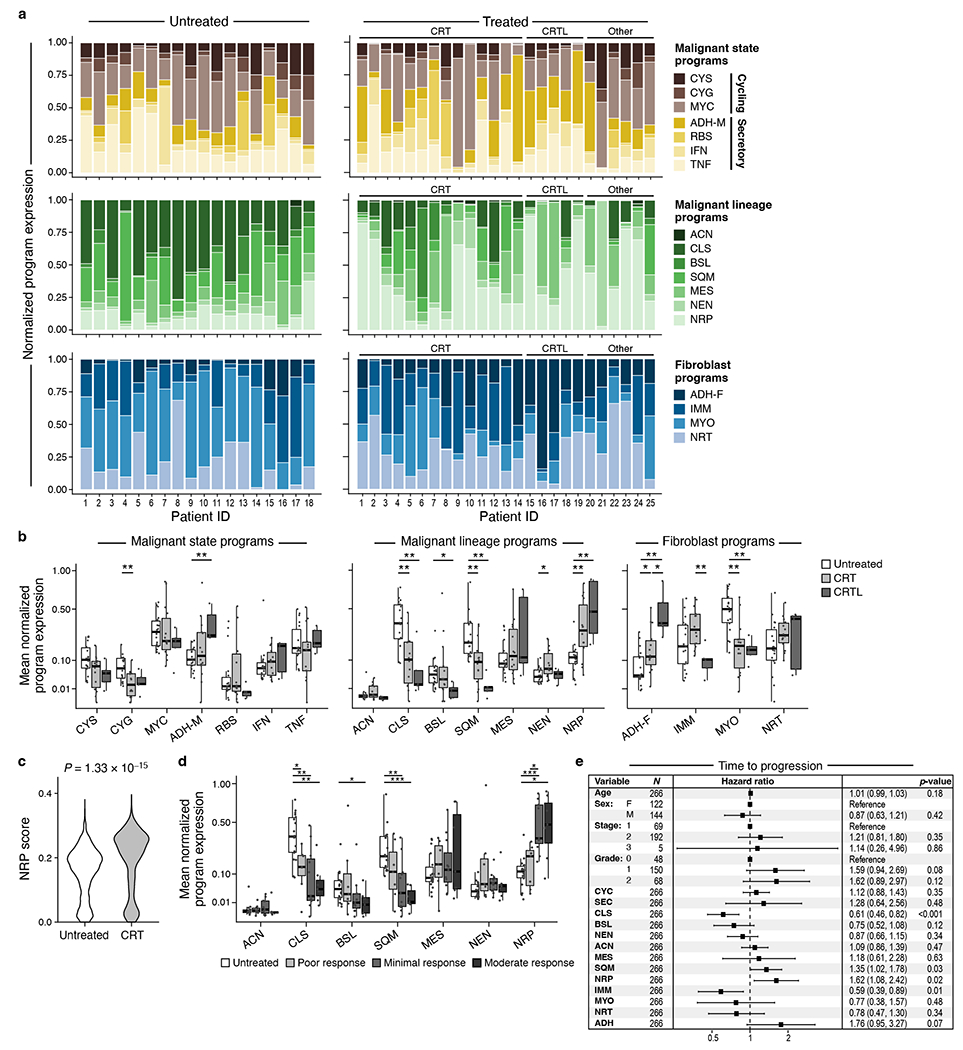
a, Intra-tumoral and inter-tumoral heterogeneity of malignant and fibroblast expression programs. Normalized expression scores (y axis) of malignant state (top), malignant lineage (middle) and CAF (bottom) programs (color legend) in each untreated (n=18, left) or treated (n=25, right) tumor (x axis). Treated patients are further ordered by treatment regimen. b, Malignant cell and CAF programs associated with treatment status. Mean normalized program expression (y axis) of malignant cell state (top), malignant cell lineage (middle), and CAF (bottom) programs (x axis) in untreated (n = 18), CRT (n=14), and CRTL (n=5) tumors. * Bonferroni adjusted p < 0.05, ** p < 0.01, *** p < 0.001, **** p < 0.0001, two-sided Mann-Whitney U test with Bonferroni correction. c, The neural-like progenitor program increases in organoids following CRT treatment. Distribution of mean expression of the top 200 cNMF-weighted genes from the neural-like progenitor program (y axis) across individual cells from matched untreated and CRT-treated organoids (x axis) derived from patient PDAC_U_12 (p=1.33x10⁻¹⁵, two-sided Mann-Whitney; untreated=2607 cells; CRT=341 cells). d, Expression of malignant lineage programs in residual neoplastic cells varies by patients’ treatment response. Distribution of mean normalized expression scores in each tumor (y axis) for each pathological treatment response grade (grayscale legend; untreated: n=18, poor: n=7, minimal: n=11, moderate: n=7) for each malignant lineage program (x axis) regardless of treatment group. * Bonferroni adjusted p < 0.05, ** p < 0.01, *** p < 0.001, **** p < 0.0001, two-sided Mann-Whitney U test with Bonferroni correction. e, Program expression and clinicopathologic parameters associated with time to disease progression using multivariable Cox regression analysis of bulk RNA-seq data from two independent cohorts of untreated, resected primary PDAC (TCGA and PanCuRx/ICGC; n=266). Data are presented as hazard ratio (HR) ± 95% confidence interval. Malignant lineage: NRP=neural-like progenitor, SQM=squamoid, MES=mesenchymal, ACN=acinar-like, NEN=neuroendocrine-like, BSL=basaloid, CLS=classical. Malignant state (aggregate): CYC=cycling, SEC=secretory. Fibroblast: IMM=immunomodulatory, NRT=neurotropic, ADH-F=adhesive, MYO=myofibroblastic progenitor.