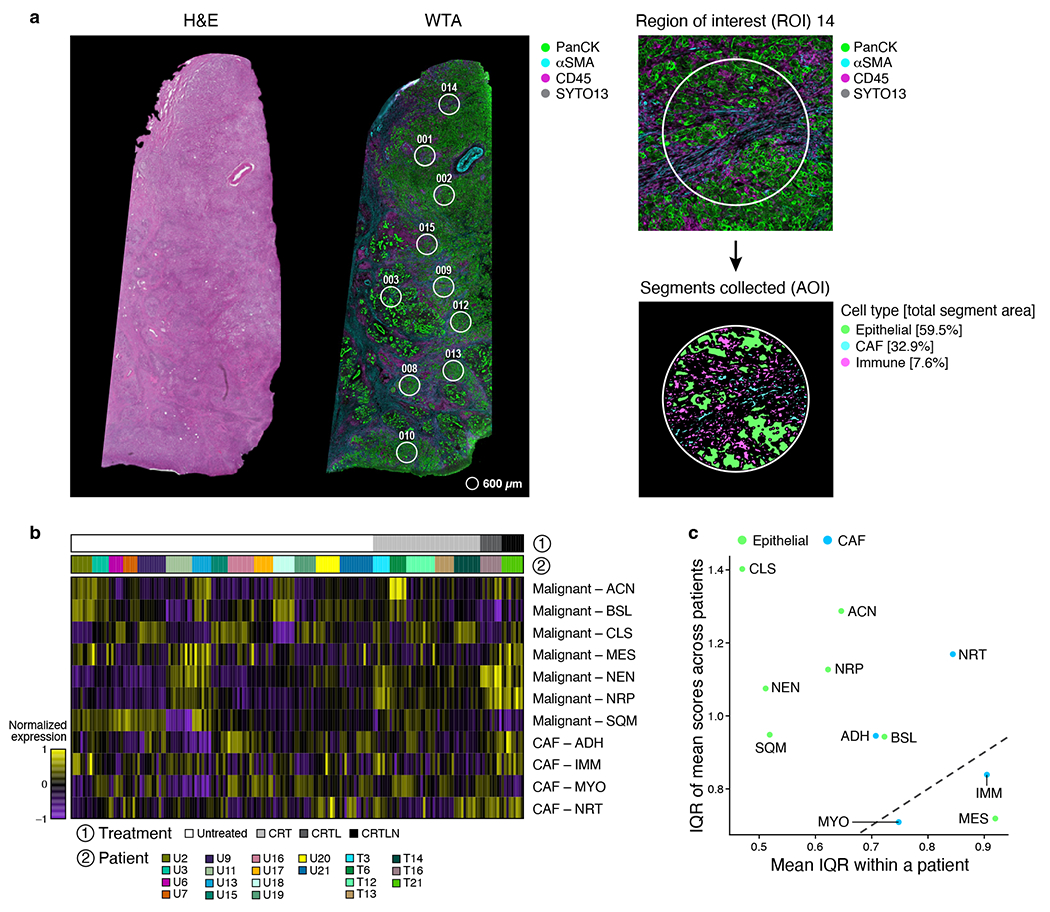
Figure 6 |. Spatial mapping of malignant and CAF programs reveals program-specific associations with intra- versus inter-tumor heterogeneity.

a, Whole Transcriptome Digital Spatial Profiling (WTA DSP). Left: Representative hematoxylin and eosin (H&E)-stained FFPE sections (5 μm thickness, left) and immunofluorescence image (GeoMx DSP, right) of consecutive sections from the same tumor FFPE block, showing selected regions of interest (ROIs, circles). WTA DSP was performed on 21 independent human PDAC tumors. Gray=SYTO13 (nuclear stain), green=anti-panCK, magenta=anti-CD45, cyan=anti-αSMA. Right: Example ROI (circle, 600 μm diameter) with segmentation masks used to enrich for the epithelial, CAF, and immune compartments and percent of total segment area occupied by each compartment. b,c, Higher variation across tumors than within tumor ROIs. b, Normalized expression (color scale) of malignant cell (top rows) and fibroblast (bottom rows) programs in each AOI (columns) across patients (color bar 2, color legend) and treatment status (grayscale bar 1 and color legend). c, Program expression variation between patients (y axis, interquartile range/IQR of the mean program score for each tumor) and within patients (x axis, mean of IQR across all ROIs within a tumor). Dotted line x=y.
