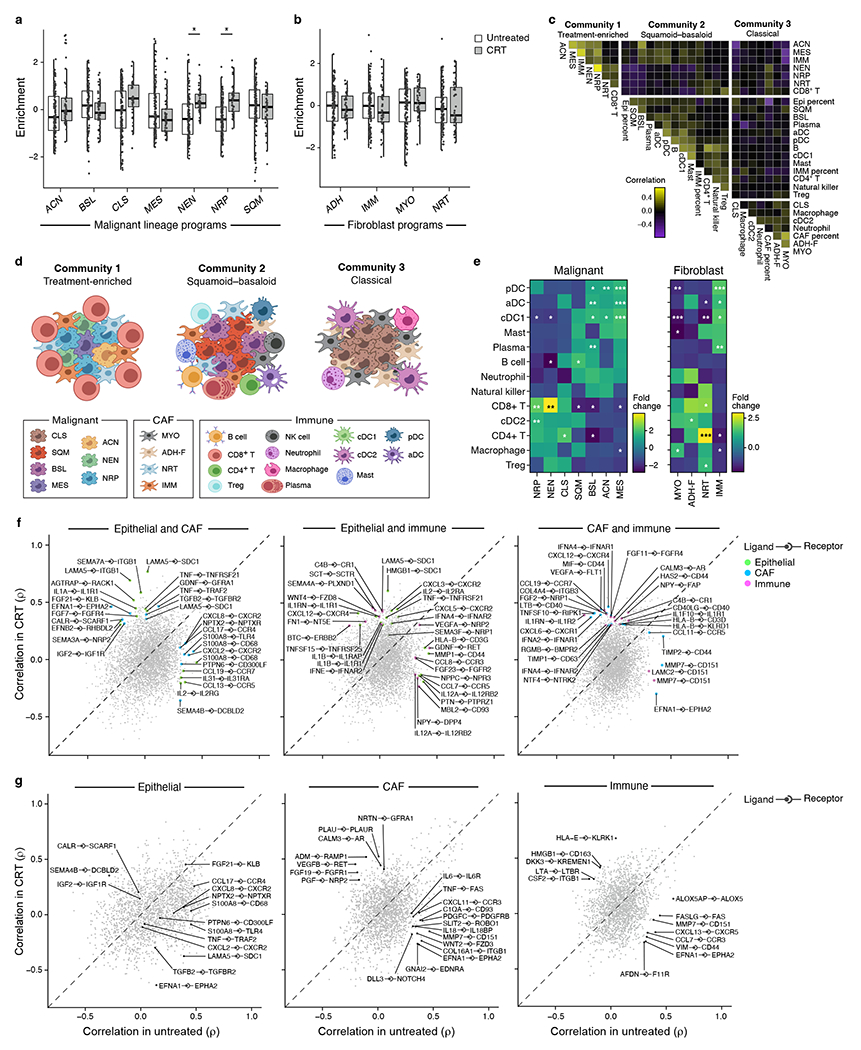
Figure 7 |. Spatial analysis of malignant programs, CAF programs and immune cell composition reveals three distinct multicellular communities and treatment-associated receptor-ligand interactions.

a,b, Digital spatial profiling shows enrichment of neural-like progenitor and neuroendocrine-like program after neoadjuvant CRT. Distribution of z-score normalized ssGSEA enrichment scores (y axis) of malignant (a) and fibroblast (b) programs (x axis) in AOIs from CRT (gray; n=5) and untreated (white; n=14) tumors. Box depicts interquartile range (IQR) with median marked as horizontal line. The whiskers correspond to 1.5 x IQR. * p < 0.05, mixed-effects model (Methods). c,d, Three multicellular communities with distinct malignant, CAF, and immune features. c, Pearson correlation coefficient (color bar) of the scores/proportions of each malignant, CAF, and immune feature (rows, columns) across ROIs. Rows and columns are ordered by hierarchical clustering. d, Schematic of key features of each multicellular community as defined in c. Malignant lineage: NRP=neural-like progenitor, SQM=squamoid, MES=mesenchymal, ACN=acinar-like, NEN=neuroendocrine-like, BSL=basaloid, CLS=classical. Fibroblast: IMM=immunomodulatory, NRT=neurotropic, ADH-F=adhesive, MYO=myofibroblastic progenitor. Created with BioRender.com. e, Malignant and CAF programs associated with immune cell composition. Fold change (color bar) of inferred immune subset proportions (rows) between the top quartile scoring ROIs and the bottom quartile scoring ROIs for each malignant (columns; left) or fibroblast (columns; right) program. f,g, Spatially correlated receptor-ligand pairs across (f) and within (g) compartments. Spearman rank correlation coefficient of expression of receptor-ligand pairs (gray dots) across paired epithelial:CAF (f, left), epithelial:immune (f, middle), CAF:immune (f, right), epithelial:epithelial (g, left), CAF:CAF (g, middle), and immune:immune (g, right) segments within the same ROI across all ROIs in CRT-treated (y axis) or untreated (x axis) tumors. Selected receptor-ligand pairs that were differentially correlated in CRT-treated or untreated tumors are labeled and colored based on the segment expressing the ligand (f, color legend). Dotted line: x=y.
