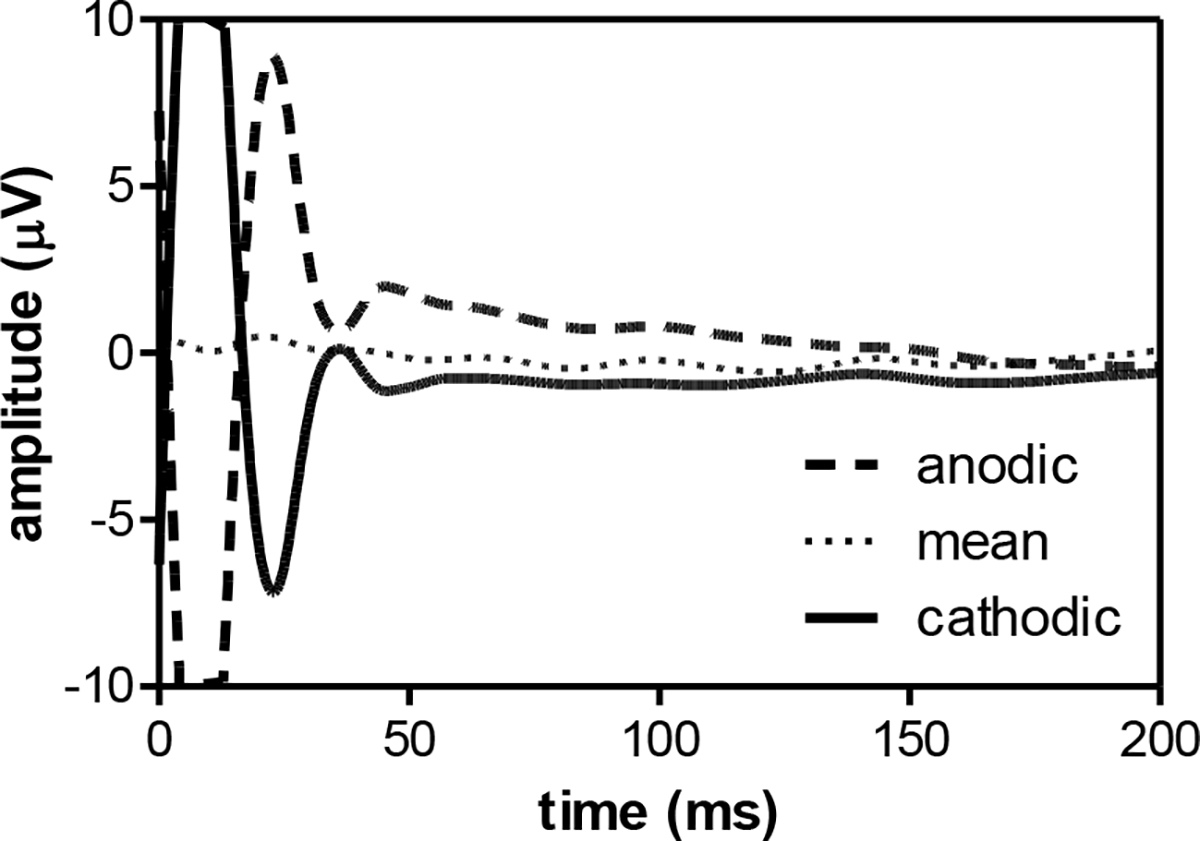
Fig. 6.

Average eERG traces at 30 μA in S5 of two runs using anodic-first (dashed line, 156 accepted epochs after adaptive averaging) and cathodic-first stimuli (176 epochs, solid line). After epoch-by-epoch averaging, stimulus artifact and signal drift were substantially reduced (158 epochs, dotted line). Traces shown were corrected for drift using linear regression, but averaging of both stimulus polarities was necessary for robust drift removal. In practice, drift removal was performed after polarity averaging. Note that the sample eERGs are scaled to visualize the stimulus artifacts (i.e., increased y-scaling, and only the first 200 ms of the eERG are shown).
