
Fig. 8.
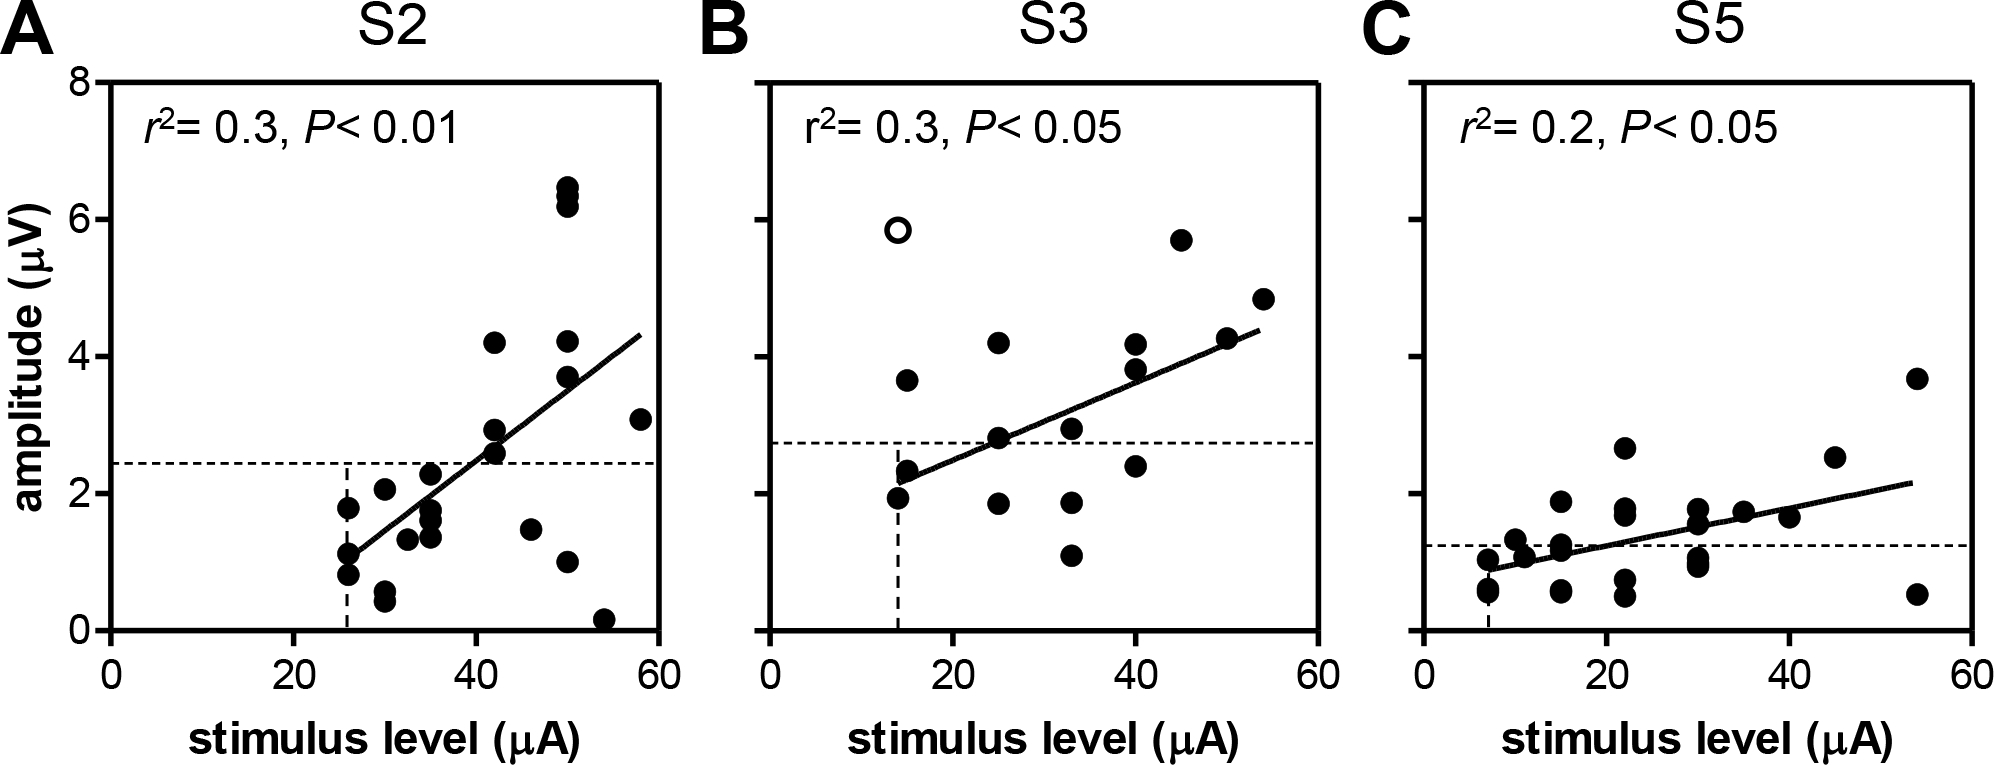
eERG amplitude as a function of stimulus level for S2 (A), S3 (B) and S5 (C). Insets show the correlation coefficients of the linear regression analysis and significance level of F-tests on the slope. One value was excluded from analysis in S3 (open circle). Vertical lines: subjective threshold; horizontal lines: objective threshold (2·SD).