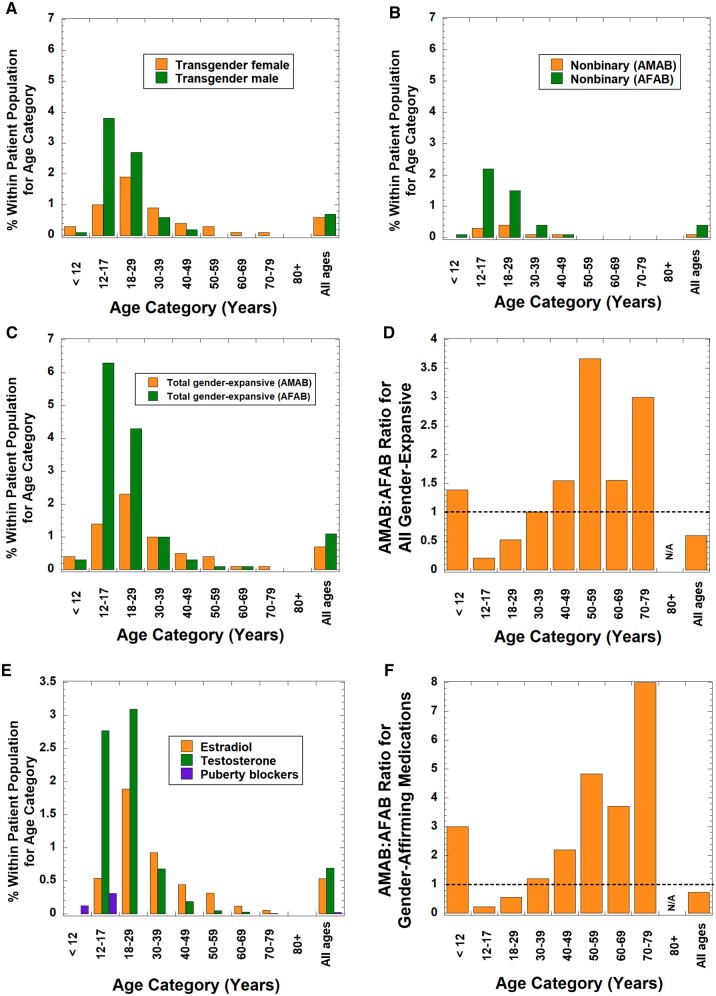
Figure 6.
Ratios of assigned male at birth (AMAB) compared to assigned female at birth (AFAB) for gender-expansive identity and use of gender-affirming therapy in different age categories. (A) Breakdown of transgender male patients compared to transgender female as a percentage of total patients within specific age distributions. (B) Breakdown of AMAB nonbinary patients compared to AFAB nonbinary patients as a percentage of total patients within specific age distributions. (C) Breakdown of all gender-expansive patients (including transgender, nonbinary and other gender-expansive identities) into those who are AMAB compared to AFAB as a percentage of total patients within specific age distributions. (D) Ratio of AMAB to AFAB for all gender-expansive patients within specific age distributions. The dashed line represents a ratio of 1.0. (E) Breakdown of gender-affirming medications within specific age distributions. (F) Ratio of AMAB to AFAB for patients who were receiving gender-affirming medications within specific age distributions. Total patient population is 123 441 (<12 years, N = 6547; 12–17 years, N = 6177; 18–29 years, N = 17 123; 30–39 years, N = 15 452; 40–49 years, N = 14 963; 50–59 years, N = 18 508; 60–69 years, N = 22 692; 12–17 years, N = 15 515; 80 years or older, N = 6464).

