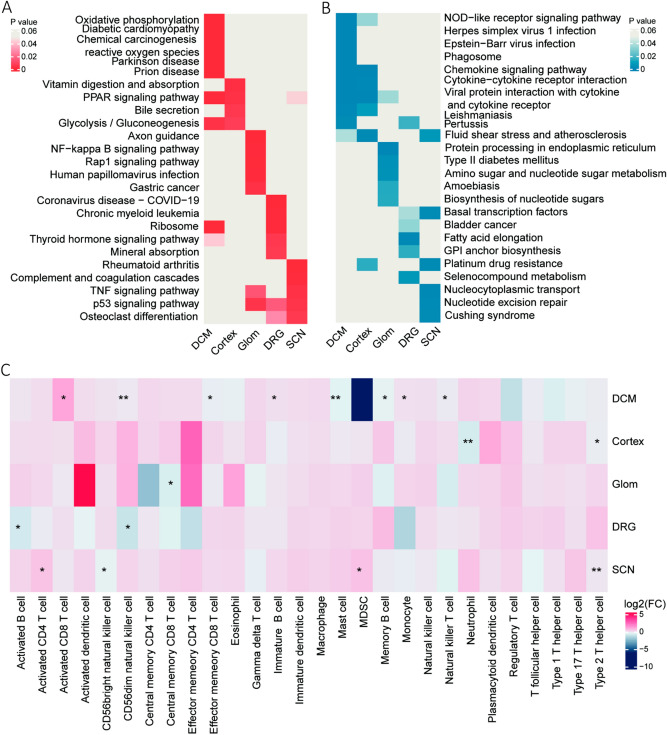
Figure 3.
Compare the differences among different diabetic complications. (A) Heatmap showed the p-value of the top 5 up-regulated KEGG pathway from different diabetic complications. (B) Heatmap showed the p-value of the top 5 down-regulated KEGG pathway from different diabetic complications. (C) Heatmap showed the fold change of immune cell infiltration in different diabetic complication groups, compared to control. *P < 0.05; **P < 0.01.

