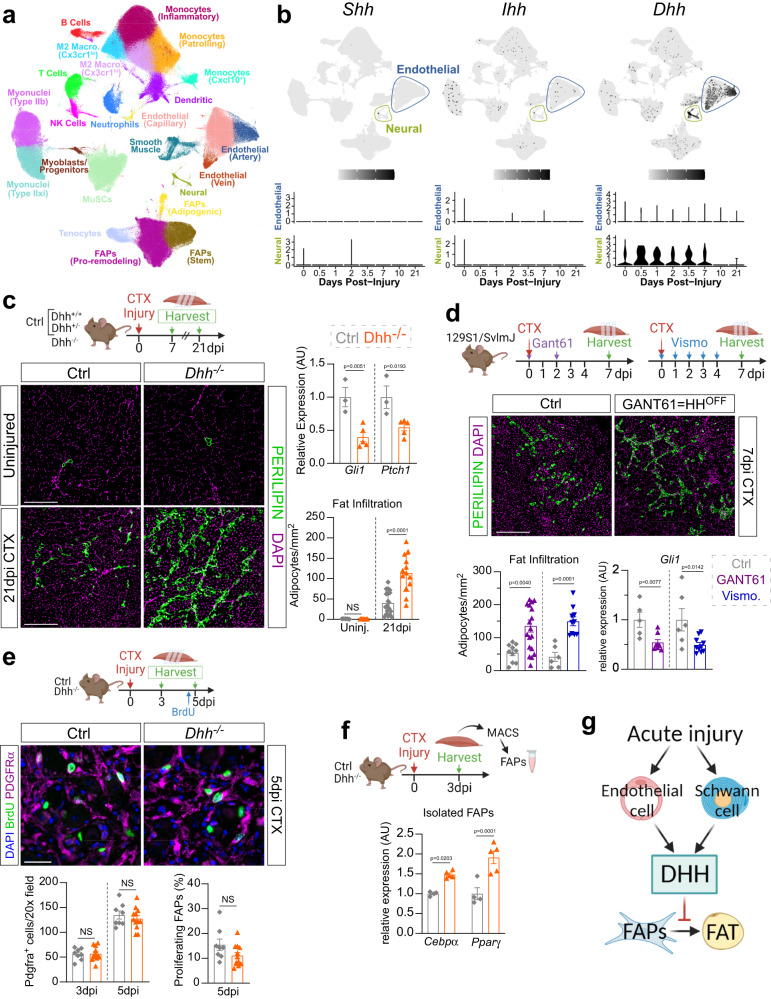
Fig. 1. The key Hh ligand DHH acts as an endogenous adipogenic brake during muscle regeneration.
a UMAP (Uniform Manifold Approximation and Projection) plot of 111 published single-cell and single-nucleus RNA-sequencing datasets of skeletal muscle before and after injury. b UMAP plots showing aggregated log-normalized expression of the Hh ligands Shh (Sonic), Ihh (Indian), and Dhh (Desert), and their log-normalized expression within the endothelial or neural cluster at different time points post injury. c RT-qPCR for Gli1 and Ptch1 at 7dpi (days post injury) post CTX (cardiotoxin) injury (ctrl (control) n = 3; Dhh−/− n = 5). Immunofluorescence for adipocytes (PERILIPIN+, green) in uninjured and injured TA (tibialis anterior) muscle. DAPI (purple) marks nuclei. Scale bar: 250 µm. Quantifications of the number of adipocytes per area (Uninjured ctrl n = 5, Dhh−/− n = 7; 21dpi ctrl n = 20; Dhh−/− n = 13). d Immunofluorescence for PERILIPIN+ adipocytes (green) at 7 dpi. DAPI (purple) marks nuclei. Scale bar: 250 µm. Quantification of adipocytes per injured area 7 dpi CTX injury of mice administered with Gant61 (vehicle treated: n = 10; Gant61 treated: n = 18) or Vismodegib (Vehicle ctrl: n = 6; Vismodegib treated: n = 10). RT-qPCR for Gli1 of Gant61 (Vehicle ctrl: n = 5 T; Gant61 treated: n = 7) and Vismodegib (vehicle ctrl: n = 6; Vismodegib treated: n = 10) treated mice. e Immunofluorescence of BrdU+ cells (green) and FAPs (PDGFRα+ cells; magenta) at 3 dpi. DAPI (purple) marks nuclei. Scale bar: 25 µm. Quantifications of (Left) total PDGFRα+ cells per 20x field 3- and 5 dpi in Dhh−/− (3dpi n = 12; 5dpi n = 12) and ctrl (3dpi n = 8; 5dpi n = 8) mice. (Right) Percent of proliferating FAPs (BrdU+ PDGFRα+ cells; % of total FAPs) 5 dpi in Dhh−/− (n = 12) and ctrls (n = 8). f RT-qPCR for Cebpα and Pparγ from MACS-purified FAPs 3 dpi in Dhh−/− (n = 5 mice) and ctrls (n = 4 mice). g Model: After an acute injury, endothelial and Schwann cells express Dhh. DHH-mediated Hh activation represses IMAT formation through inhibiting the adipogenic differentiation of FAPs. All data are represented as mean ± SEM. Each graph data point in c-e represents one TA muscle. An unpaired two-tailed t test or a one-way ANOVA followed by a Dunnet’s multiple comparison was used.

