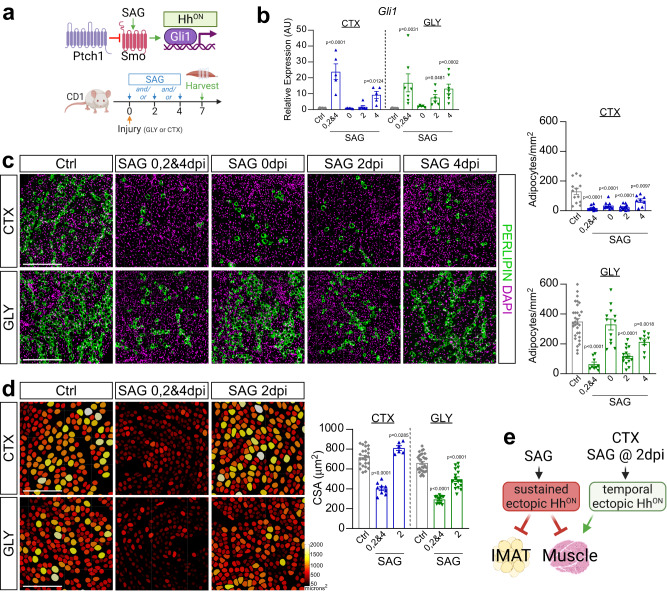
Fig. 3. Hh controls IMAT formation and myofiber regeneration in an injury- and temporal-dependent manner.
a Experimental outline. b RT-qPCR for Gli1 7 days post CTX (cardiotoxin) or GLY (glycerol) injury when treated with vehicle (CTX: n = 11; GLY: n = 8), SAG (Smoothened Agonist) at 0-, 2- and 4 days post injury (dpi) (CTX: n = 5; GLY: n = 7), at 0 dpi (CTX & GLY: n = 5), at 2 dpi (CTX & GLY: n = 6) or SAG at 4 dpi (CTX: n = 5; GLY: n = 7). c Left: Immunofluorescence for PERILIPIN+ adipocytes (green) 7 days post CTX (top) or GLY (bottom) injury when treated with vehicle, SAG at 0-, 2- and 4 dpi, SAG at 0 dpi, SAG at 2 dpi or 4 dpi. Nuclei were visualized with DAPI (magenta). Scale bars 250 µm. Right: Quantification of adipocytes per injured area (mm2) from CTX (top) and GLY (bottom) 7 days post injury. Vehicle control (CTX: n = 13; GLY: n = 31), SAG at 0-, 2- and 4 dpi (CTX: n = 10; GLY: n = 9), SAG at 0 dpi (CTX & GLY: n = 12), SAG at 2 dpi (CTX: n = 12; GLY: n = 15) or SAG at 4 dpi (CTX: n = 8; GLY: n = 9). d Left: Color-coded myofibers based on cross sectional area (CSA) of CTX (top) and GLY (bottom) injured mice treated with SAG at 0-, 2- and 4 dpi, and SAG at 2 dpi. Scale bars: 250 µm. Right: Average CSA (µm2) at 7 dpi. Vehicle control (CTX: n = 27; GLY: n = 30), SAG at 0-, 2- and 4 dpi (CTX: n = 9; GLY: n = 13), SAG at 2 dpi (CTX: n = 6; GLY: n = 17). e Model: SAG-induced ectopic Hh activation blocks IMAT formation in both injuries. Sustained ectopic Hh activation also impairs muscle regeneration, while a single bolus of SAG at day 2 post CTX, but not GLY, improves regeneration. Each graph data point in b-d represents one TA muscle. All data are represented as mean ± SEM. One-way ANOVA followed by a Dunnet’s multiple comparison was used.

