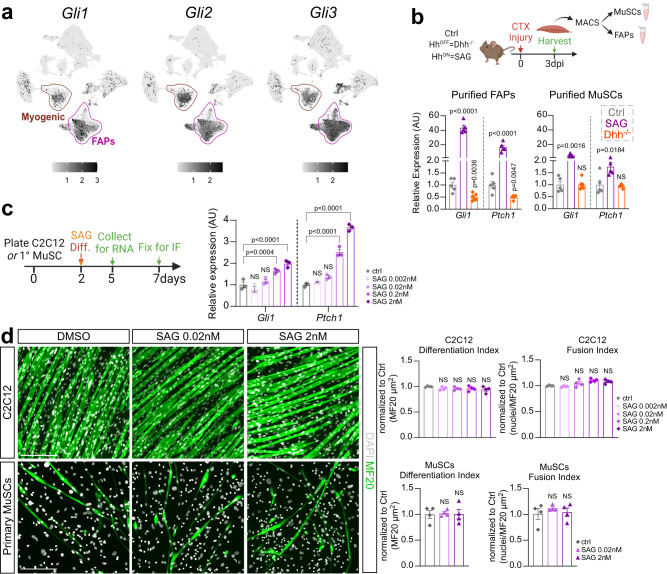
Fig. 4. FAPs are the main Hh responder.
a UMAP (Uniform Manifold Approximation and Projection) plots displaying aggregated log-normalized expression of the Hh transcription factors Gli1, Gli2 & Gli3. b RT-qPCR of expression of Gli1 and Ptch1 at 3 dpi CTX (cardiotoxin) from MACS- (magnetic activated cell sorting) isolated purified FAPs (Left) and MuSCs (Right) of control (ctrl) (n = 5), Dhh−/− (n = 5) and SAG- (Smoothened Agonist) treated mice (n = 5). c Left: Experimental design. Right: RT-qPCR of expression of Gli1 and Ptch1 of C2C12 (n = 3 replicates per experimental group) cells 5 days after induction of differentiation in ctrl and varying concentrations of SAG-treated cells (0.002 nM, 0.02 nM, 0.2 nM and 2 nM). d Left: Immunofluorescence of mature myofibers labeled with MF20 (Myosin heavy chain; green) and nuclei with DAPI (white) 7 days post myogenic induction of C2C12 (top) or primary MuSCs (bottom). Cells were treated with either vehicle (DMSO) or SAG (0.02 nM and 2 nM). Scale bars: 200 µm. Right: Quantifications (n = 4 replicates for all experimental groups) of the differentiation index (MF20+/µm2) and fusion index (nuclei per MF20+/µm2) of C2C12 (Top) or primary MuSC-derived (Bottom) myofibers. All data are represented as mean ± SEM. One- way ANOVA followed by a Dunnet’s multiple comparison was used.

