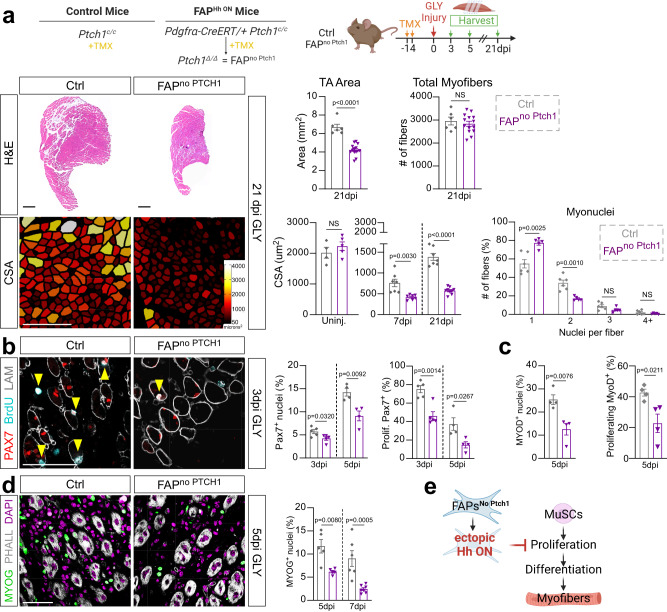
Fig. 6. FAP-specific Hh activation inhibits MuSC expansion and proliferation.
a Left: Hematoxylin and Eosin (H&E) staining of FAPno Ptch1 and ctrl mice 21 dpi (days post injury). Scale bars: 500 µm. Myofibers color-coded according to size of FAPno Ptch1 and ctrl mice 21 dpi. Scale bars: 250 µm. Right: Quantification of total TA area 21 days post GLY (glycerol) of FAPno Ptch1 (n = 14) and ctrl (n = 6) mice. Quantification of total fiber numbers 21 dpi of FAPno Ptch1 (n = 14) and ctrl (n = 6) mice. Average CSA (cross sectional area) of uninjured (FAPno Ptch1 n = 5; ctrl n = 4), 7 dpi (FAPno Ptch1 n = 7; ctrl n = 7) and 21 dpi (FAPno Ptch1 n = 9; ctrl n = 7) mice. Distribution of number of myonuclei per fiber (% of total fibers) from FAPno Ptch1 (n = 5) and ctrl (n = 6) mice 21 dpi. b Left: Immunofluorescence for PAX7+ (MuSCs (muscle stem cells), red), BrdU+ (proliferating cells, cyan) and LAMININ (myofiber outline, white) 3 dpi. Double positive cells marked by arrowhead. Scale bar: 50 µm. Right: Quantifications of percent of PAX7+ nuclei (% of total nuclei) and proliferating PAX7+ MuSCs (% of total MuSCs) at 3 dpi (n = 5 for each) and 5 dpi (n = 4 for each). c Percent of MYOD+ and BrdU+ MYOD+ myoblasts at 5 dpi in FAPno Ptch1 (n = 4) and ctrl (n = 4) mice. d Left: Immunofluorescence of MYOG+ nuclei (green) and PHALLOIDIN (white) 5 dpi. Nuclei visualized by DAPI (magenta). Scale bar: 50 µm. Right: Percent of MYOG+ nuclei at 5 dpi (n = 5 for each) and 7 dpi (FAPno Ptch1 n = 7 TAs; ctrl n = 6 TAs). e Model: Ectopic Hh activation in FAPs indirectly represses proliferation and expansion of MuSCs resulting in a reduced myoblast pool and smaller myofibers. Each graph data point in a-d represents one TA muscle. All data are represented as mean ± SEM. An unpaired two-tailed t test or a one-way ANOVA followed by a Dunnet’s multiple comparison was used.

