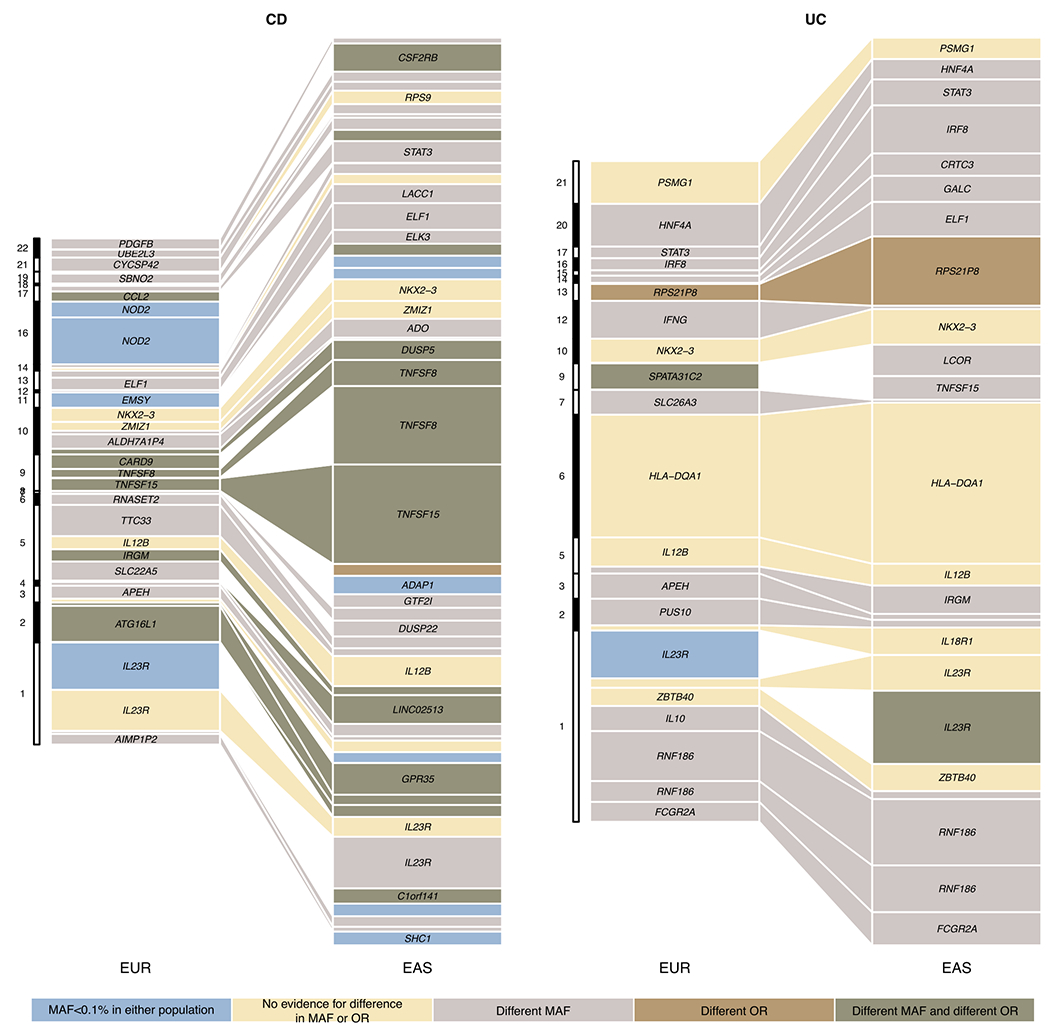
Extended Data Fig. 8. Variance explained for IBD associations across EUR and EAS.

We included all loci from Supplementary Table 8. For loci with fine-mapping analyses performed, we used the conditional OR (using COJO, Methods) for variants with the highest PIP in each credible set to account for multiple independent associations. We took fine-mapping results from ref 12 for EUR and from this study for EAS. For loci with no fine-mapping results, we used the index variant (variant with the most significant P value) as the proxy for the loci. We only plotted associations that have variance explained greater than 0.3% in either EAS or EUR. Different MAF is defined as Fst > 0.01, and different OR is defined as heterogeneity test P value < 0.05 after Bonferroni correction. Because the heterogeneity test was corrected using a higher multiple testing burden, the significance for a handful of loci, e.g., RNF186, can be different from Figure 3c. Nearest genes to the associations were used as labels for associations when the text space is available.
