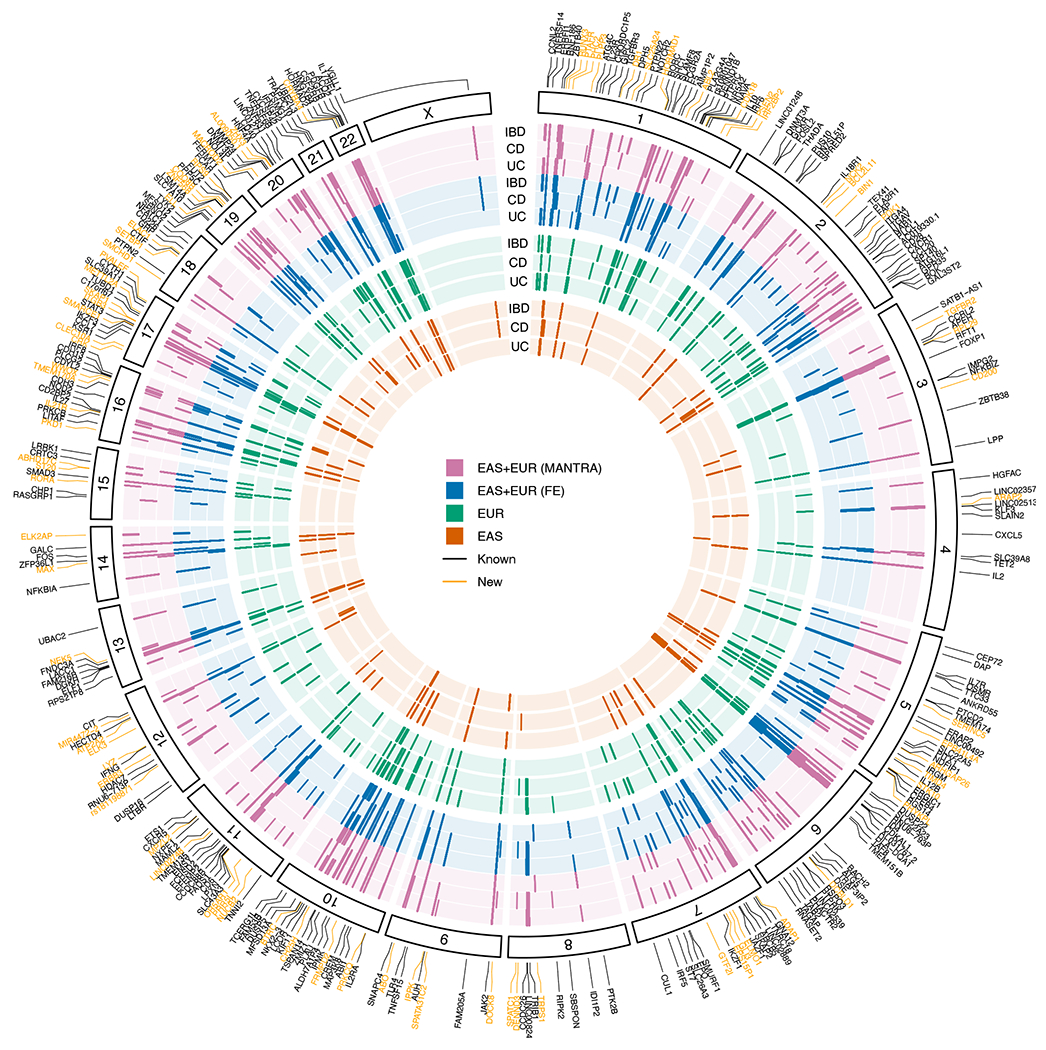
Figure 2 |. IBD genetic associations.

Each layer of the plot represents results from a GWAS analysis, with results from the same ancestry grouped by the color. Within each ancestry, UC, CD, and IBD are ordered from the inner to the outer layer. Genome-wide significant associations (P < 5 × 10⁻⁸) were plotted as short lines. Known indicates previously reported IBD loci4,7,8,34–43. New indicates new IBD loci from the meta-analysis (MANTRA and FE) and/or the EAS analysis.
