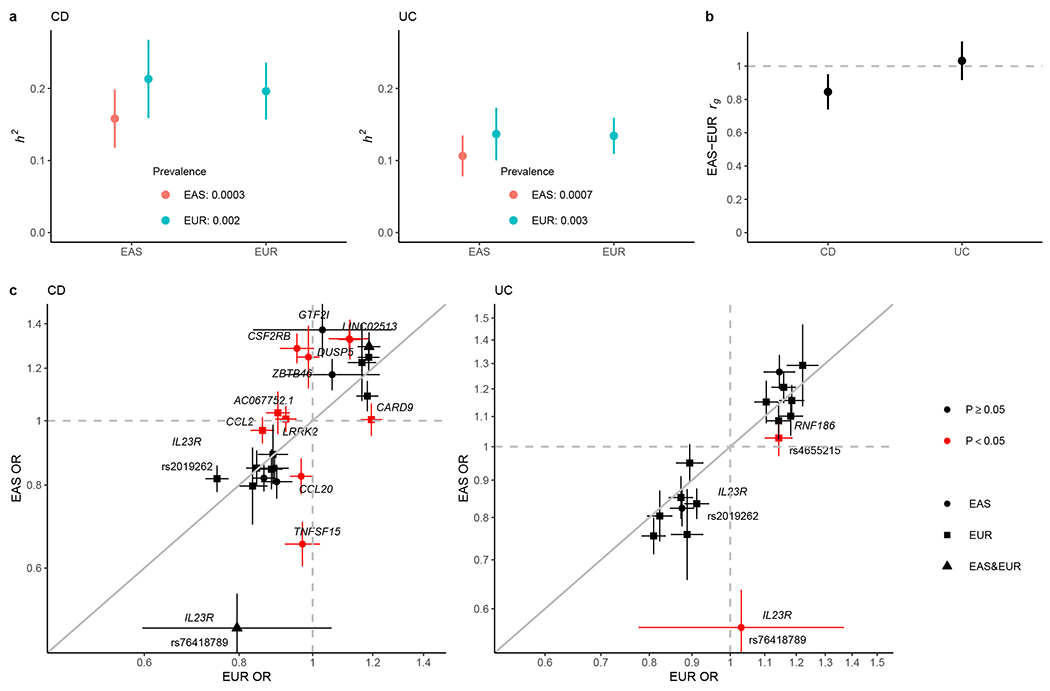
Figure 3 |. Comparative genetic architecture across EAS and EUR.

a, SNP-based heritability (h2) on the liability scale. As the population prevalence in EAS can be underestimated for under diagnosis in certain regions in Asia, we calculated the h2 also assuming the prevalence in EUR as the upper bound of the estimate. b, Genetic correlation (rg) between EAS and EUR for CD and UC, respectively. In a and b, the sample sizes used to derive EAS and EUR h2 and EAS-EUR rg were 17,493 and 40,266 for CD, and 17,470 and 45,975 for UC, respectively. Only NFE samples were used in the EUR analysis. c, Per allele genetic effect (OR) for IBD putative causal variants in EAS (from this study) and EUR (from ref. 4). OR is from conditional analysis if there are multiple genetic associations in the locus (Methods). OR was aligned such that the minor allele in EUR was the tested allele. The sample size used to derive OR in EAS and EUR were 22,828 and 40,266 for CD, and 22,318 and 45,975 for UC, respectively. Only NFE samples were used in the EUR analysis. Cochrane’s Q test (two-sided) was used for testing heterogeneity. Variants are colored according to their heterogeneity P-values, which are reported in Supplementary Table 12. P, Bonferroni corrected P-value threshold for coloring. We used the number of putative causal variants tested for the correction such that (P < 0.05 / 25 for CD and P < 0.05 / 16 for UC). Results are plotted as mean value ± 95% confidence interval (error bar).
