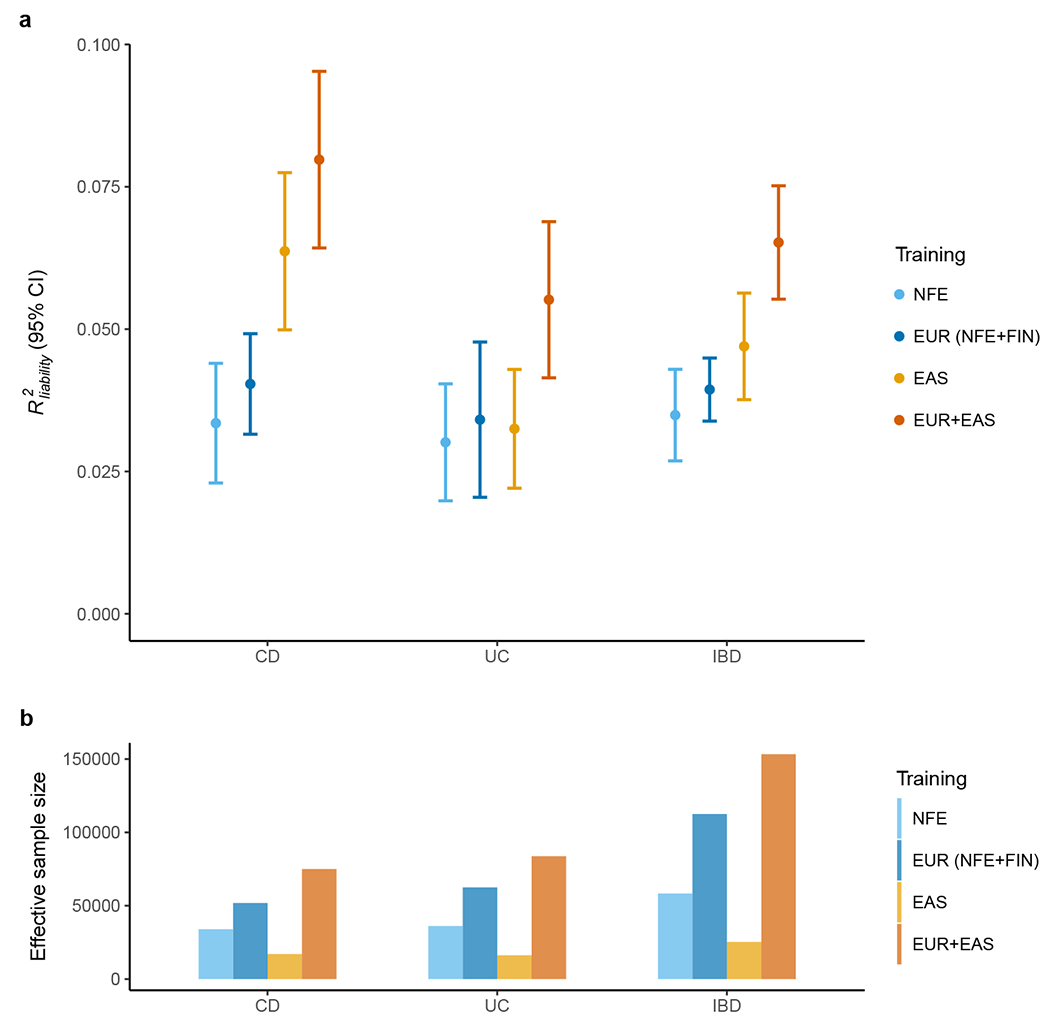
Figure 4 |. Polygenic risk prediction on the Chinese samples.

a, Prediction accuracy was measured as R2 on the liability scale using the population prevalence in China as an approximation for Asia. We randomly split SHA1 subjects into discovery, validation and testing 100 times (Methods). All other EAS samples were used as discovery. Results are plotted as mean value ± 95% confidence interval of R2 across the 100 replicates (error bar). b, Effective sample size of training datasets, calculated as 4 / (1 / ncase + 1 / ncontrol).
