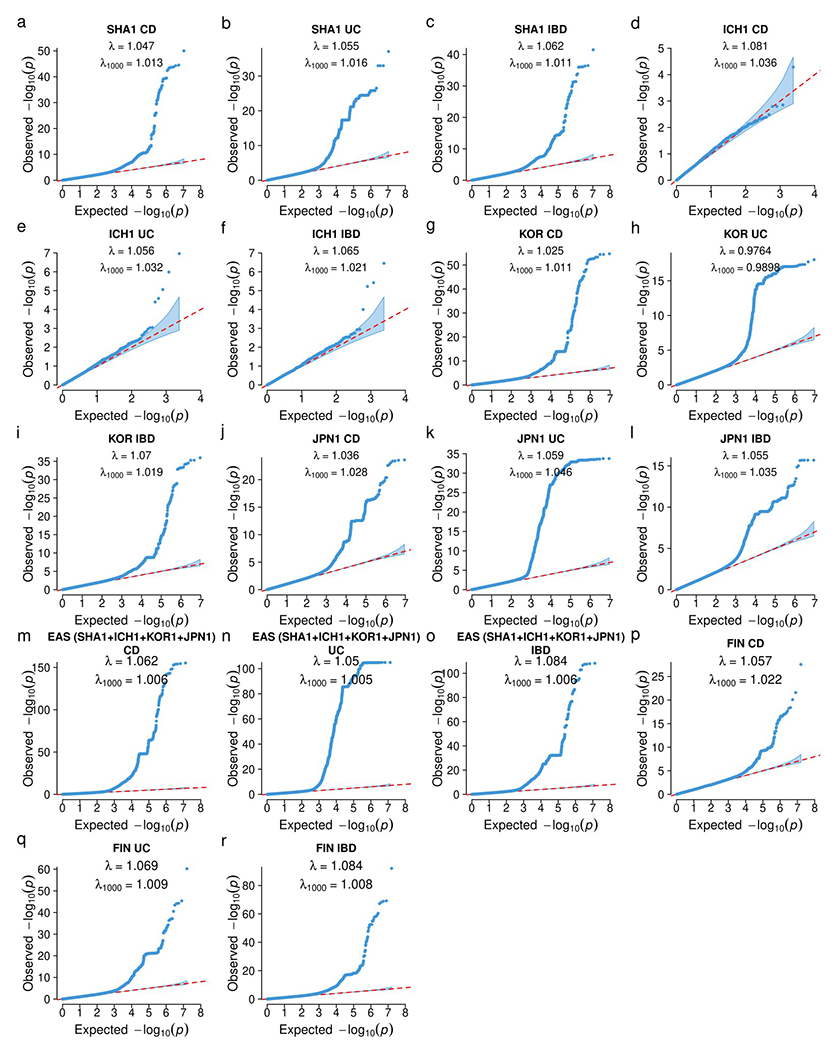
Extended Data Fig. 1. Quantile-Quantile plots for IBD genetic associations.

λ: genomic inflation factor; λ1000 : scaled inflation factor for an equivalent study of 1000 cases and 1000 controls. The dots indicate variants. Shaded area indicates the 95% confidence interval under the null distribution. a-c, SHA1. d-f, ICH1 (only the designated null variants in ImmunoChip were used). g-i, KOR1. j-l, JPN1. m-o, meta-analysis including all EAS samples (SHA1, ICH1, KOR1, and JPN1), p-r, FIN. a, d, g, j, m, p are for CD. b, e, h, k, n, q are for UC. c, f, i, l, o, r are for IBD.
