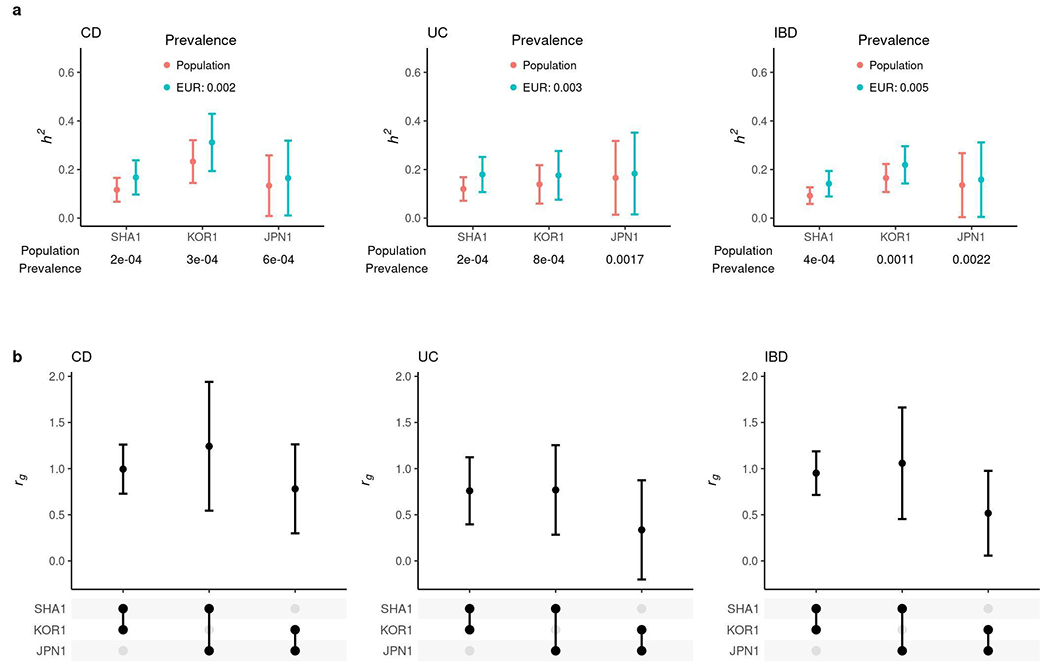
Extended Data Fig. 5. Comparative genetic architecture within EAS.

a, SNP-based heritability in the liability scale with the prevalence in its respective population or the European population. b, Genetic correlation (rg). In a and b, the sample sizes used to derive SHA1, KOR1 and JPN1 h2 and their rg were 8,831, 6,038 and 2,624 for CD, and 8,679, 5,988 and 2,803 for UC, respectively. Results are plotted as mean value ± 95% confidence interval (error bar).
