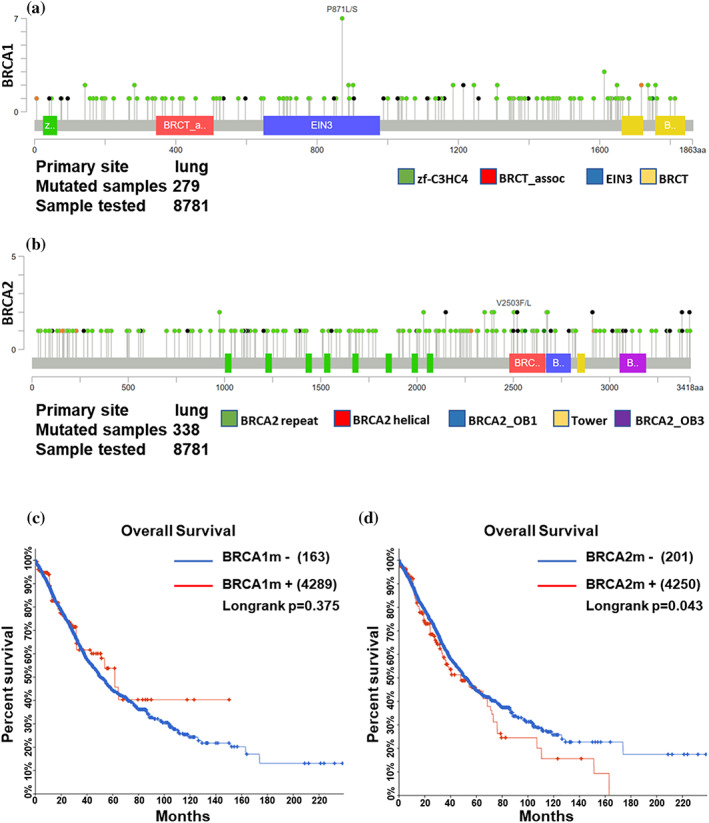
FIGURE 3.

Analysis of BRCA1/2 mutations according to cBioportal. (a, b) The distributions of mutations on BRCA1 (a) and BRCA2 (b) in lung cancer samples from cBioportal. (c, d) Kaplan–Meier curve showing the overall survival rate of cBioportal lung cancer samples classified by mutation of BRCA1 (c) or BRCA2 (d)
