FIGURE 6.

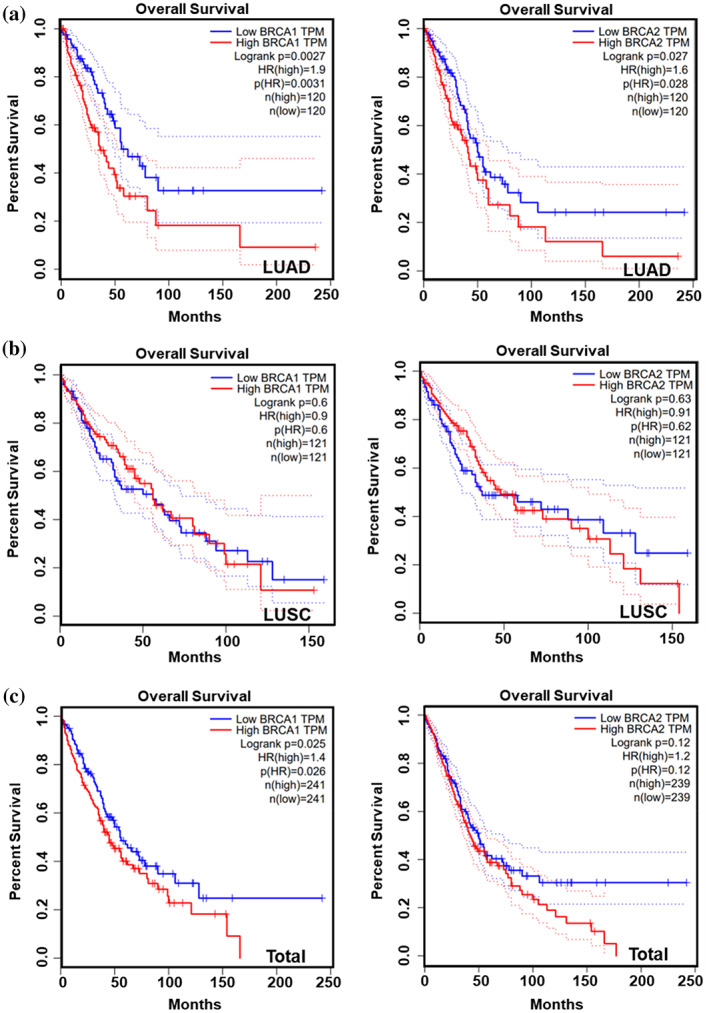
Survival analysis of BRCA1/2 in lung cancer. (a–c) Kaplan–Meier curve showing the overall survival rate of LUAD (a), LUSC (b) or lung cancer samples (c) classified by expression of BRCA1 or BRCA2 by GEPIA.

Survival analysis of BRCA1/2 in lung cancer. (a–c) Kaplan–Meier curve showing the overall survival rate of LUAD (a), LUSC (b) or lung cancer samples (c) classified by expression of BRCA1 or BRCA2 by GEPIA.