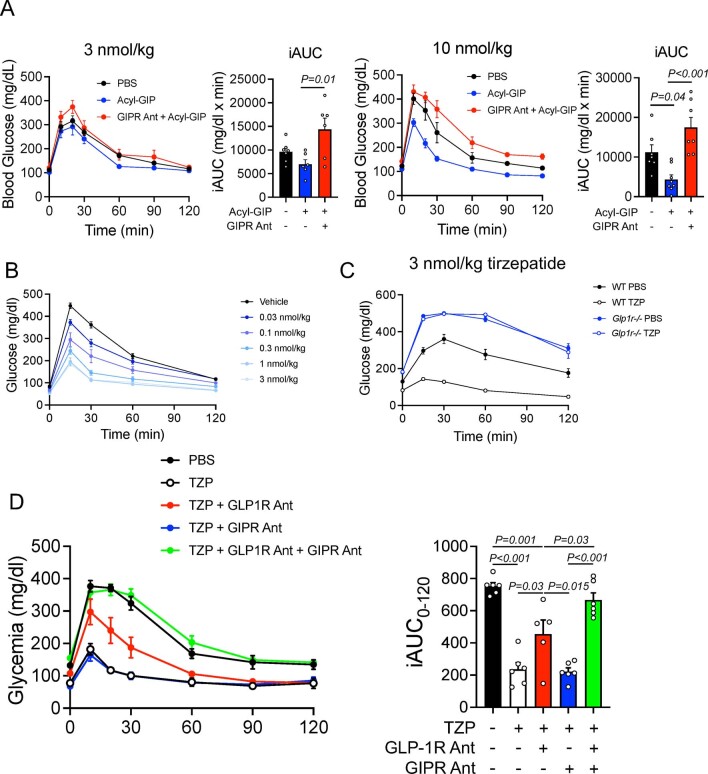
Extended Data Fig. 1. Tirzepatide activity in mice.
A) Intraperitoneal glucose tolerance test (IPGTT) in wild-type (WT) mice. Mice were pretreated 2 hours prior to glucose with either PBS or a GIPR antagonist, 1 hour prior to glucose with either PBS or acyl-GIP (3 or 10 nmol/kg dose). Glucose was given after a 5 hour fast at 1.5 mg/kg. The integrated area under the curve (iAUC) was calculated using the glycemia measure immediately before PBS/GIPR antagonist administration. 3 nmol/kg dose: PBS/PBS, n = 7; PBS/Acyl-GIP, n = 6, GIPR Antag/Acyl-GIP, n = 6. 10 nmol/kg dose: PBS/PBS, n = 7; PBS/Acyl-GIP, n = 8, GIPR Antag/Acyl-GIP, n = 7. B) A dose-response curve for tirzepatide during an IPGTT in WT mice. (n = 5/group) B) Tirzepatide during an IPGTT in WT and Glp1r knockout mice. (n = 8/group) C) 30 nmol/kg tirzepatide in WT mice treated with an antagonist for the GLP-1R (Jant-4), GIPR, or both. N = 8/group. All values are mean + /- SEM. The following statistical tests were used: A, B, and D) one-way ANOVA with Tukey’s posthoc test, C) two-way ANOVA with Tukey’s posthoc test.

