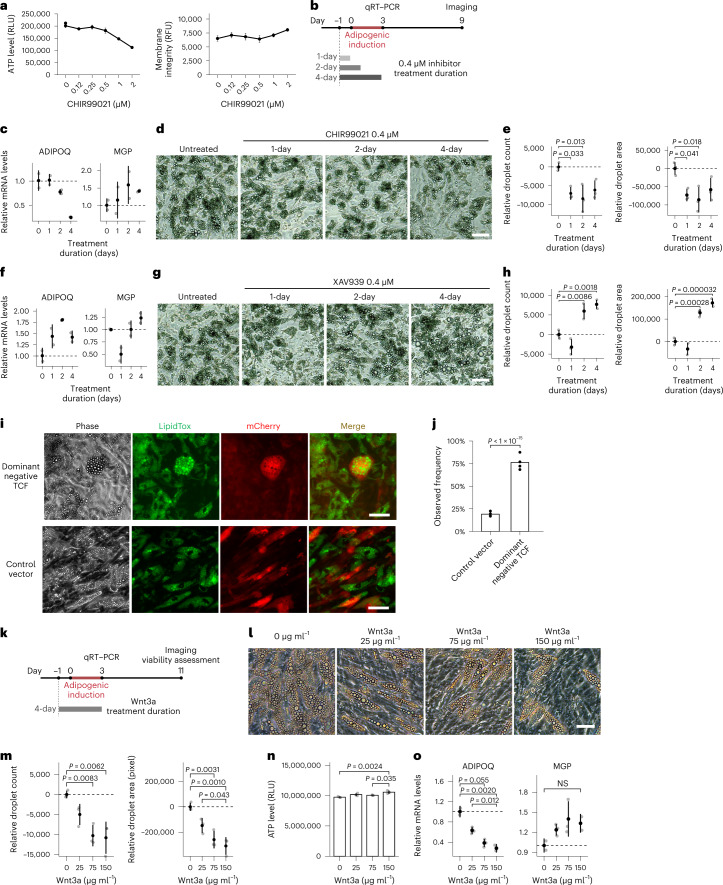
Fig. 4. Canonical Wnt signaling controls cell fate balance between adipogenic differentiation and progenitor maintenance.
a, ATP levels (left) and membrane permeability (right) in 10-d adipogenic-induced cells exposed to CHIR99021 (n = 3). b, Schematic of the assay assessing effects of low dose, acute Wnt perturbation. c, ADIPOQ and MGP mRNA in cells treated with 0.4 μM CHIR99021 as in b, after 3 d of differentiation (n = 2). d, Images of cells treated with 0.4 μM CHIR99021 as in b, after 9 d of differentiation. e, Lipid droplet quantification of cells in (c) (n = 3). f, ADIPOQ and MGP mRNA levels of cells treated with 0.4 μM XAV939 after 3 d of differentiation (n = 2). g, Images of cells treated with 0.4 μM XAV939 as indicated in b, after 9 d of differentiation. h, Lipid droplet quantification of cells in g (n = 3). i, Fluorescence microscopy images of 7-d adipogenic-induced cells transduced with vectors expressing control or dominant-negative TCF and an mCherry reporter 72 h before adipogenic induction. Cells were stained with LipidTOX Green neutral lipid stain before imaging. j, Frequency of adipogenesis among the transduced, mCherry-positive cells. Quantitation represents four independent experiments with cells from four separate donors. A 2 × 2 contingency table was built for the quantification from each experiment (Extended Data Fig. 4b,d,f,h) and the P value was determined by two-sided Cochran–Mantel–Haenszel chi-squared test. k, Schematic of the assay to assess effects of acute canonical Wnt activation with recombinant Wnt3a during initial days of adipogenic induction. l, Images of cells treated with Wnt3a per described in k. m, Lipid droplet quantitation of cells in l (n = 3). n, ATP level of cells in l measured immediately after live-cell imaging (n = 3). o. ADIPOQ and MGP mRNA levels of cells treated with Wnt3a measured by qRT–PCR after 3 d of differentiation (n = 2). All data plots in this figure are shown as means ± s.d. Each dot represents a data point from a biological replicate unless stated otherwise. One-way ANOVA is used for statistical analysis unless stated otherwise. Scale bars, 50 μm. NS, not significant.

