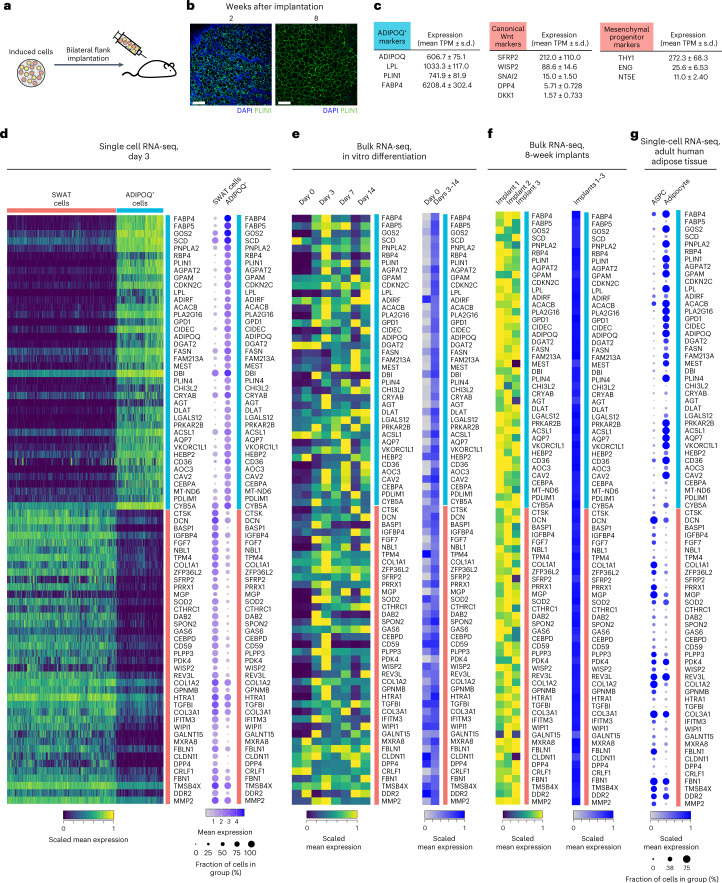
Fig. 6. Evidence for SWAT cells in developing and adult adipose tissue in vivo.
a, Schematic of the human adipogenic-induced progenitor mouse implantation model. b, Histological sections of implants 2 weeks (left) and 8 weeks (right) after injection. Scale bar, 150 μm. c, mRNA levels of the ADIPOQ+ cell markers and canonical Wnt target genes in the implants measured by bulk RNA-seq. Results represent summary of three implants from three mice. d, Heat maps of individual cells and summary dot-plot of gene expressions of the top 40 differentially expressed gene from SWAT and ADIPOQ+ cells, derived from the single-cell dataset described in Fig. 2. e, Gene expression of the top 40 marker gene of SWAT and ADIPOQ+ cells from the adipogenesis time course bulk RNA-seq dataset described in Fig. 1d, presented as individual samples (left) or summarized by adipogenic induction status (right). f, Heat maps of expression of the top 40 differentially expressed gene of SWAT and ADIPOQ+ cells from the human reads of the implant dataset presented as individual samples (left) or summarized (right). g, Dot-plot of gene expression of the top 40 marker gene of SWAT and ADIPOQ+ cells in the published single-cell/single-nuclei adipose tissue transcriptome of adult human ages 29–73 years published by Emont et al.34.

