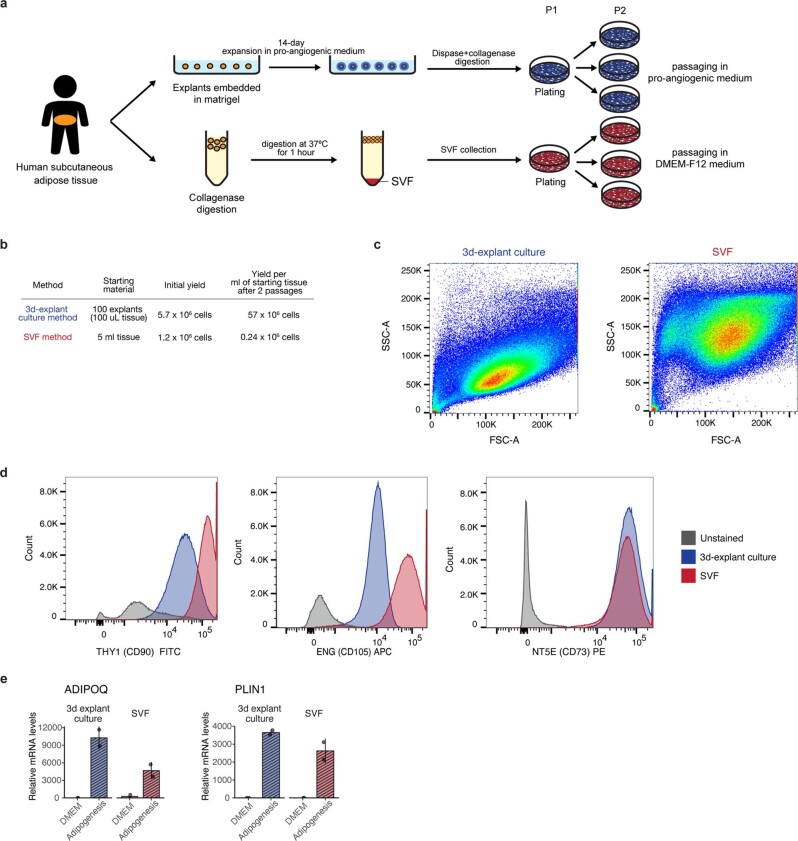
Extended Data Fig. 1. Comparison of 3-dimensional culture-derived progenitor cells and cells obtained from the stromal vascular fraction.
a, Schematic of the two methods for obtaining progenitors. b, Progenitor cell yields from the two methods using adipose tissue from the same donor (Donor 72). c, Forward and side-scatter plots of passage 3 progenitors harvested from the two methods, assessed by flow cytometry. d, Flow cytometry analysis of mesenchymal progenitor marker levels in passage 3 cells obtained from the two methods. e, qRT-PCR assessment of adipocyte markers ADIPOQ and PLIN1 mRNA levels in passage 3 cells collected from the two methods after 7-day of adipogenic induction. Data are shown as mean ± SD. Each dot represents a data point from a biological replicate.

