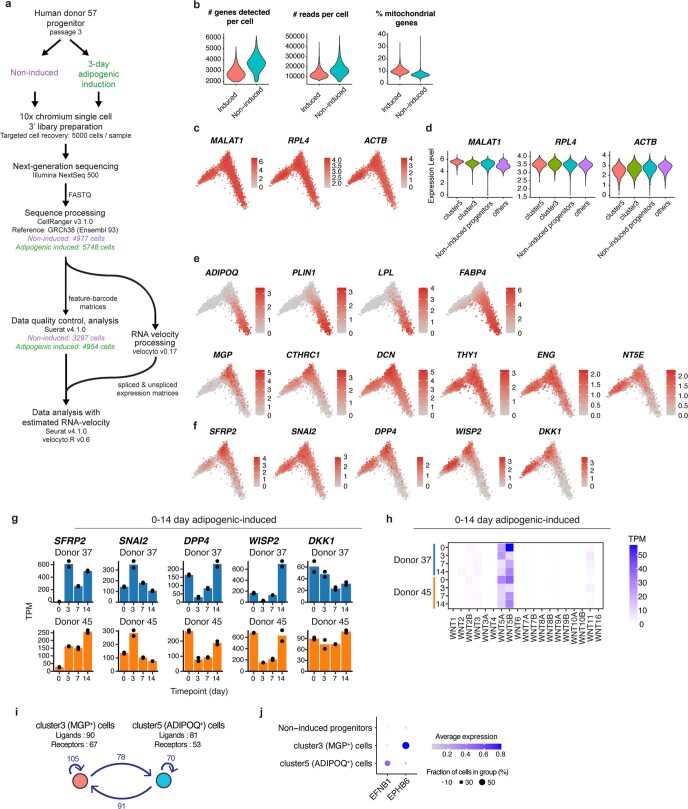
Extended Data Fig. 2. Processing, quality control and data verification of the single-cell RNA-seq profiling of non-induced and 3-day adipogenic-induced progenitors.
a, Schematic of the sample and bioinformatics processing of the study. b, Violin plots of the number of genes/reads detected and estimated percentage of mitochondrial genes in cells that had passed quality control. c, Selected housekeeping gene expression in PCA projection. d, Violin plots of gene expression distribution of selected housekeeping genes. e, Expression of top marker genes for clusters 3 and 5 in PCA projection. f, Expression of Wnt target genes in PCA projection. g, Gene expression profiles of Wnt target genes upregulated in cluster 3/MGP+ cell markers in the adipogenesis time course RNA-seq dataset presented in Fig. 1d. h, Wnt ligands queried from the adipogenesis time course RNA-Seq dataset presented in Fig. 1d. i, Ligand–receptor analysis identifies multiple ligand–receptor interacting pairs between the cluster 3/MGP+ cells and cluster 5/ADIPOQ+ cell. j, Dot-plot of ephrin-B receptor 6 (EPHB6) and ephrin B1 (EFNB1) in cluster 3/MGP+ cells and cluster 5/ADIPOQ+ cells.

