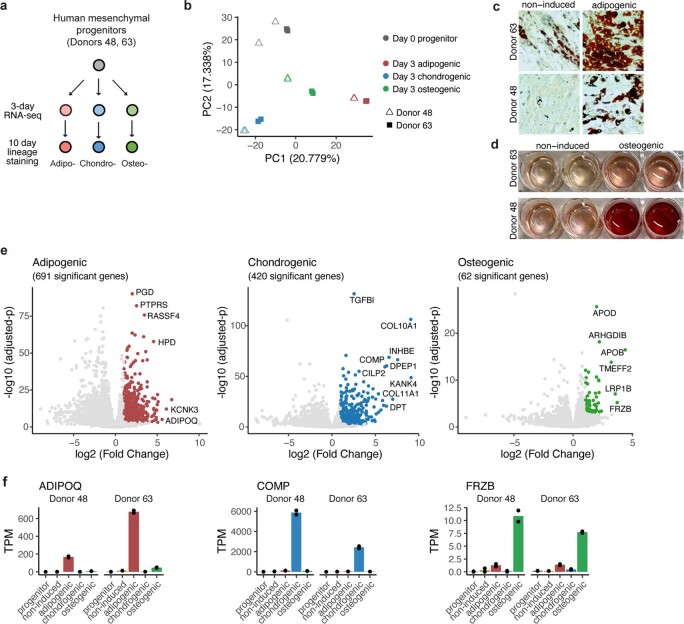
Extended Data Fig. 3. Identification of early osteogenic and chondrogenic lineage marker with multi-lineage time course bulk RNA-seq.
a, Schematic of the RNA-seq profiling study. b, Scatter-plot of the first two principal components of the RNA-seq samples. Principal component analysis was performed on the expression of the top 1000 most variable genes across all samples. c, Oil Red O staining of progenitor cells after 10-day adipogenic induction. Scale bars, 50 µm. d, Alizarin Red S staining of progenitor cells after 10-day osteogenic induction. e, Volcano plots of differential gene expression analysis between cells induced toward the annotated lineage compared to cells induced to other two lineages. Differentially expressed genes were defined as those with log2 fold change > 1 and adjusted P value < 0.001. f, Gene expression of the most distinctive lineage marker genes, selected based on magnitude and significance in the differential expression analysis as well as specificity. ADIPOQ: adiponectin, COMP: cartilage oligomeric matrix protein, FRZB: frizzled related protein.

