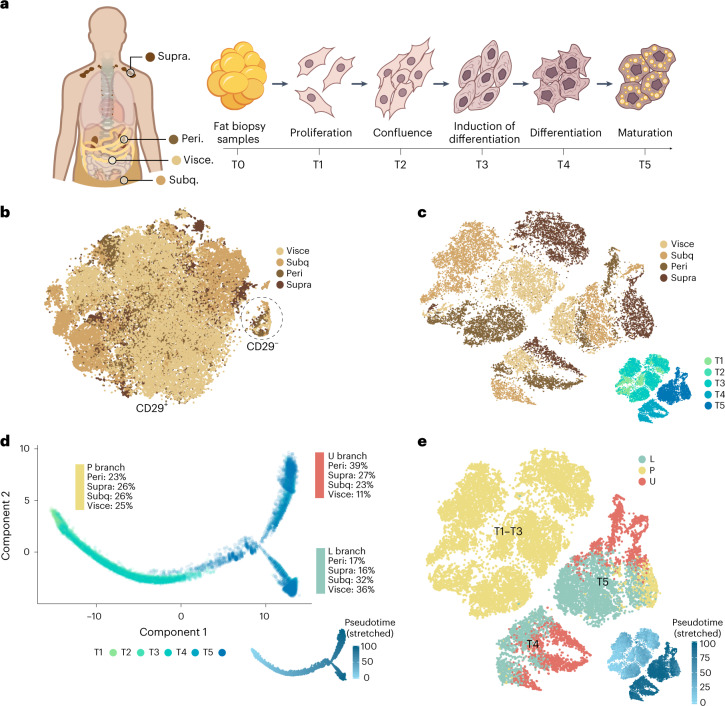
Fig. 1. Single-cell trajectory analysis of developing adipocyte progenitors.
Human adipocyte progenitors isolated from tissue biopsies of four adipose depots were collected at five time points (T1–T5) during in vitro differentiation and subsequent single-cell analysis was performed using the 10x Genomics platform. a, Overview of adipose depots and cellular developmental stages. b, t-SNE atlas generated using the Seurat alignment algorithm, analysing proliferating adipocyte progenitors (T1) derived from 11 individuals. Peri, perirenal; subq, subcutaneous; supra, supraclavicular; visce, visceral. c, t-SNE atlas of developing adipocyte progenitors (T1–T5) of four adipose depots from different individuals. The inset indicates the collection time point. Clustering analysis grouped T1–T3 samples by adipose depot and T4 and T5 samples by time point and adipose depot. d, Monocle pseudotime trajectory of adipocyte progenitors from T1–T5. Cells from T1–T3 align in a common progenitor (P) branch. Following induction of differentiation, the P branch split into an upper (U) and a lower (L) branch, thus containing cells from T4 and T5. Cells from all depots are represented in the U and L branches (the percentage of cells from each depot is indicated for each branch). The inset shows the trajectory coloured by stretched pseudotime that quantitatively measures how far an adipocyte progenitor has progressed through development. Stretched pseudotime is a normalized pseudotime scale ranging from 0 (least progressed) to 100 (most progressed). e, Cell atlas coloured by trajectory branch identities. The inset shows the cellular development as measured by pseudotime.

