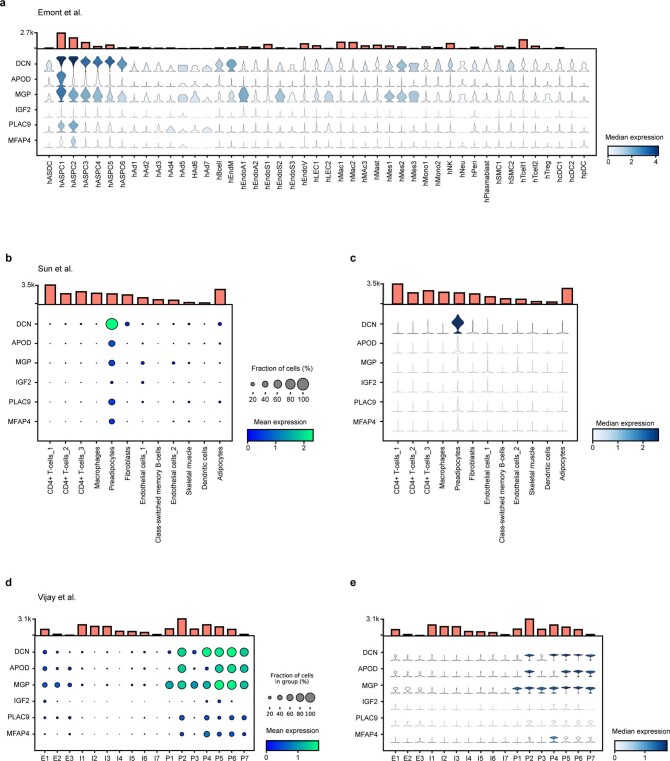
Extended Data Fig. 5. SWAT markers in previously defined APSC subpopulations.
a) Violin plot displaying the expression of top markers for SWAT cells in the ASPC subpopulations as defined (10). Bar plots on top indicates the number of cells associated with each cell type annotation. b) Dot plot and c) Violin plot displaying the expression of top markers for SWAT cells in a BAT single nuclei data set as defined (46). Bar plots on top indicates the number of cells associated with each cell type annotation. d) Dot plot and e) Violin plot displaying the expression of top markers for SWAT cells in a stromal vascular fraction data set as defined (45). Bar plots on top indicates the number of cells associated with each cell type annotation.

