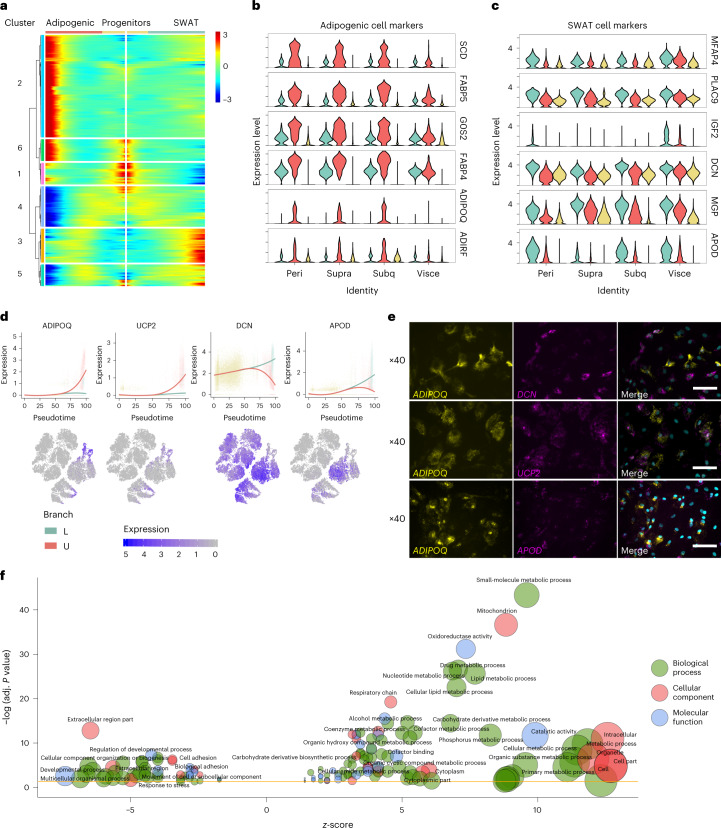
Fig. 3. Gene cluster signatures defining adipogenic and SWAT cell branches.
a, BEAM analysis identified six kinetic clusters of branch-dependent genes. b, Violin plots of adipogenic marker genes from cluster 2, showing gene expression in branches across depots. c, SWAT cell marker genes from cluster 3, showing gene expression in branches across depots. d, Expression dynamics are displayed as a function of pseudotime (stretched, ranging from 0 to 100) of marker genes for the U branch (ADIPOQ, UCP2) and the L branch (DCN, APOD). Solid lines show smoothed expression curves for each branch. e, FISH staining of human brown adipocytes collected at T5 (halfway through full maturation) using RNAscope probes for branch marker genes. Scale bar, 75 µm. f, GO term enrichment analysis visualized using REViGO and the GOplot R package.

