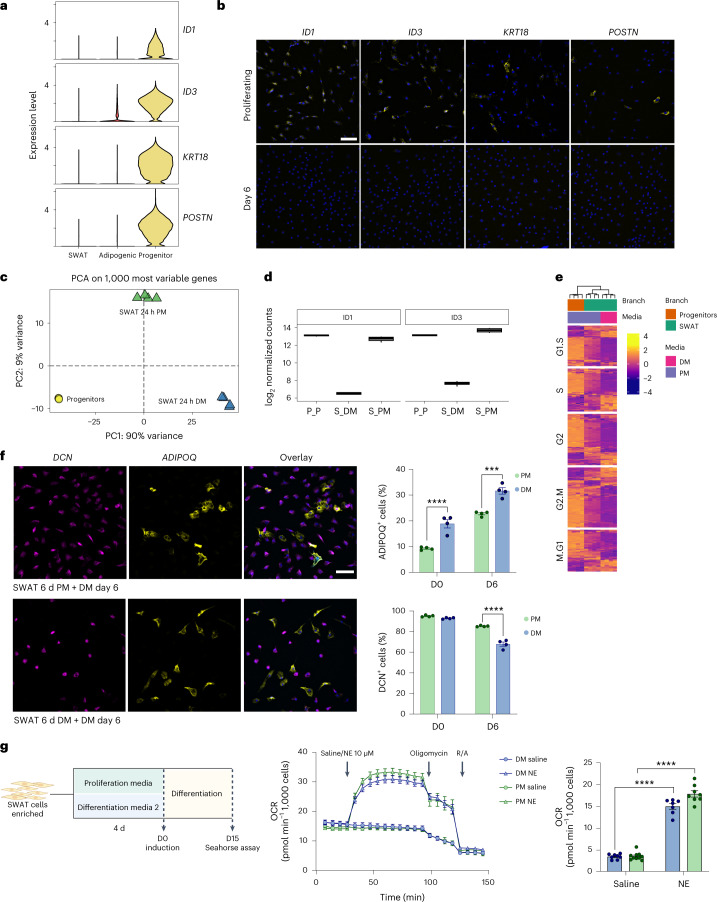
Fig. 5. Multipotency of SWAT cells.
a, Progenitor marker gene expression across branches in scRNA-seq data. b, FISH RNAscope staining validating the expression of selected progenitor markers (yellow) in proliferating brown progenitor cells but not in differentiating cells (day 6). Nuclei in blue. Scale bar, 100 µm. c, PCA of bulk RNA-seq samples based on the 1,000 most variable genes. d, RNA-seq normalized gene counts for selected progenitor markers across conditions. The centre of the box plot is the median of normalized gene expression from N = 4 replicates, expressed in log2 scale. The lower and upper hinges of the box plot are the first and third quartiles (25th and 75th percentiles), respectively. The whiskers extend from the lower/upper hinges to the smallest/largest values less than 1.5 times the interquartile range (distance between 1st and 3rd quartiles). N = 4 biologically independent samples, derived from four separate heterogeneous cell cultures, separated with four individual density gradients and subsequently cultured separately. e, Heat map of cell cycle gene expression across conditions, split by cell cycle phase. f, Enriched brown SWAT cells on day 12 of differentiation were seeded until they reached sub-confluence in either PM or DM for 6 d and then induced for differentiation. FISH staining confirmed the development of adipogenic (yellow) and SWAT (magenta) cells in both cultures. Nuclei in blue. Scale bar, 100 µm. Two-way ANOVA was used to assess the effects of differentiation in the two groups cultured in different media before differentiation. Top, quantification of ADIPOQ-positive cells (effect of differentiation: P < 0.0001; effect of cell culture media: P < 0.0001). Bottom, quantification of DCN-positive cells (effect of differentiation: P < 0.0001; effect of cell culture media: P = 0.0001). N = 4 biologically independent cell samples, cultured separately in parallel for 24 h following density gradient centrifugation between SWAT and adipogenic cells. Sidak’s post hoc test was used for comparisons between cell types, and significance values are shown in the graphs *P < 0.05, **P < 0.01, ***P < 0.001, ****P < 0.0001. Data are presented as the mean ± s.e.m. g, Experimental outline to assess the functionality of brown adipogenic cells developed from differentiated SWAT cells seeded in PM or DM (left). Created with BioRender.com. Seahorse extracellular flux analysis (right). Oxygen consumption rates were normalized to cell count. N numbers are biologically independent cell samples, cultured and differentiated separately in parallel following density gradient centrifugation between SWAT and adipogenic cells. Left, N = 10 for PM-cultured samples. N = 8 for DM-cultured samples. Right, two PM-cultured samples and one DM-cultured sample stimulated with NE were excluded due to issues with oligomycin injections, resulting in N = 8 for PM and N = 7 for DM. Right, calculated stimulated proton leak. Two-way ANOVA analyses was used to assess the effects of NE in the two groups cultured in different cell culture media before differentiation (effect of NE: P < 0.0001; effect of cell culture media: P = 0.0051). Sidak’s post hoc test was used for comparisons between NE and saline treatment, and significance values are shown in the graphs *P < 0.05, **P < 0.01, ***P < 0.001, ****P < 0.0001. Data are presented as the mean ± s.e.m. DCN, decorin; ADIPOQ, adiponectin; PM, proliferation medium. Two-way ANOVA with Sidak’s post hoc test *P < 0.05, **P < 0.01, ***P < 0.001, ****P < 0.0001. Data are presented as the mean ± s.e.m.

