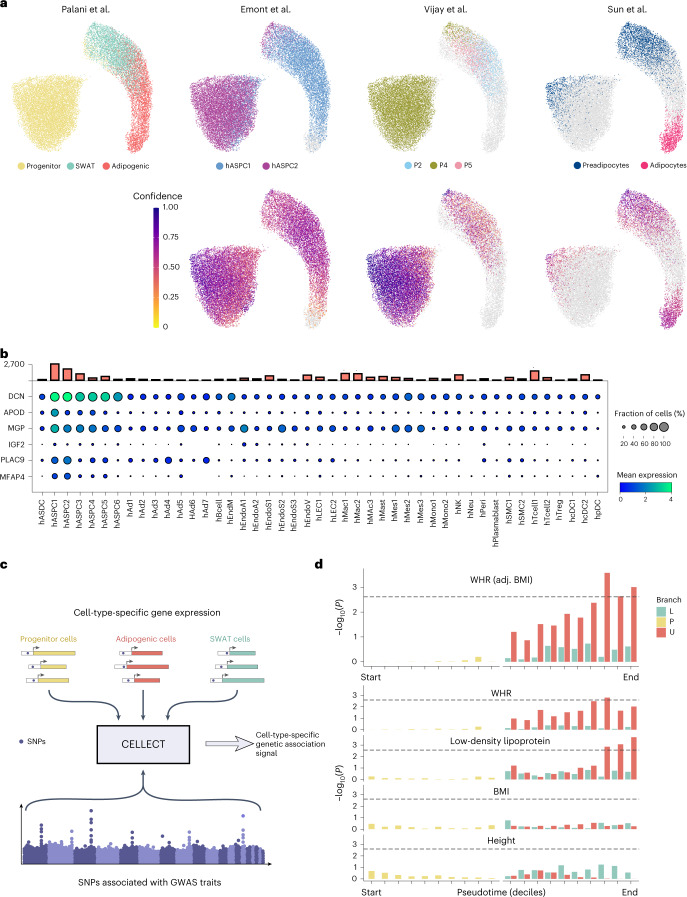
Fig. 7. Label transfer to human adipose tissue and genome-wide association study traits.
a, Uniform manifold approximation and projection dimensionality reduction scatterplots of cells from Palani et al., scRNA-seq (this work) mapped with labels transferred from reference datasets, as annotated in the figure, using Scanorama. Confidence scores are the probability of label assignment by k-nearest neighbours (kNN) classifier. b, Dot plot displaying the expression of top markers for SWAT cells in the ASPC subpopulations as defined9. Bar plot on top indicates the number of cells associated with each cell-type annotation. c, CELLECT tool method. d, CELLECT analysis of progenitor, U (adipogenic) and L (SWAT) branch cells, binned by pseudotime deciles. Adipogenic cells with the highest pseudotime values showed significant association with WHR (adjusted to BMI) and low-density lipoprotein. Other traits did not reveal any association.

