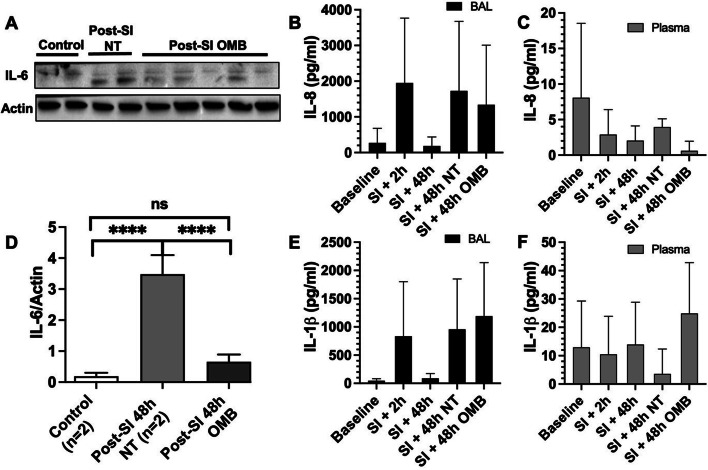
Fig. 5.
IL-6 immunoblot and IL-8 and IL-1β ELISA analysis. A, D Immunoblot analysis of IL-6 expression levels in lung tissues of Control (t = − 48 h), SI (t = − 46 h) and SI + OMB (t = 3 h) groups (p < 0.0001). B, C IL-8 expression level in BAL fluid and plasma samples of treated animals at baseline (t = − 48 h), SI + 2 h (t = − 46 h), SI + 48 h (t = − 0.5 h), NT and OMB (t = 3 h) samples. E, F IL-1β expression level in BAL fluid and plasma samples of treated animals at the same timepoints as IL-8 analysis

