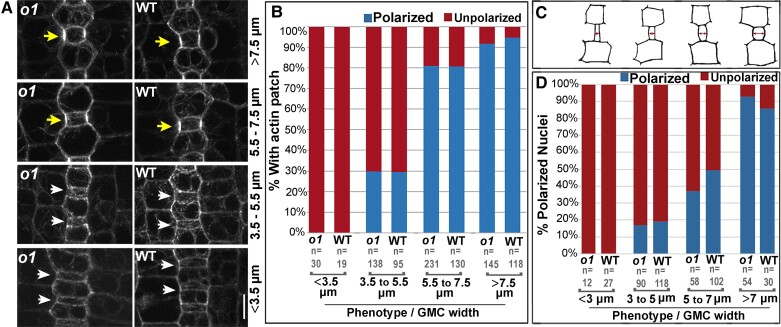
Figure 4.
Actin patch formation and nuclear migration is normal in o1. A) The stomatal division zone was examined in leaf 4 of o1-N1242A mutant plants and wild-type siblings expressing the ABD2-YFP marker. GMCs in early developmental stages, found at the leaf base (lower panels), are narrow and width increases towards the leaf tip as development proceeds (upper panels). Early SMCs flanking narrow GMCs do not form an actin patch (white arrows). SMCs at later developmental stages, flanking wider GMCs, have an actin patch (yellow arrows). B) Percentage of SMCs with a polarized actin patch at progressive developmental stages in o1-N1242A mutant plants and their corresponding wild-type siblings. C) Cartoons depicting representative cell outlines at increasing GMC widths. Red arrows indicate where GMC width was measured. D) Percentage polarized nuclei in SMCs at progressive developmental stages in o1-N1242A mutant plants and their corresponding wild-type siblings. Fisher's exact tests comparing o1 mutants to their respective wild-type siblings indicate no differences between mutants and wild type at each developmental stage (P > 0.05 in all cases).

