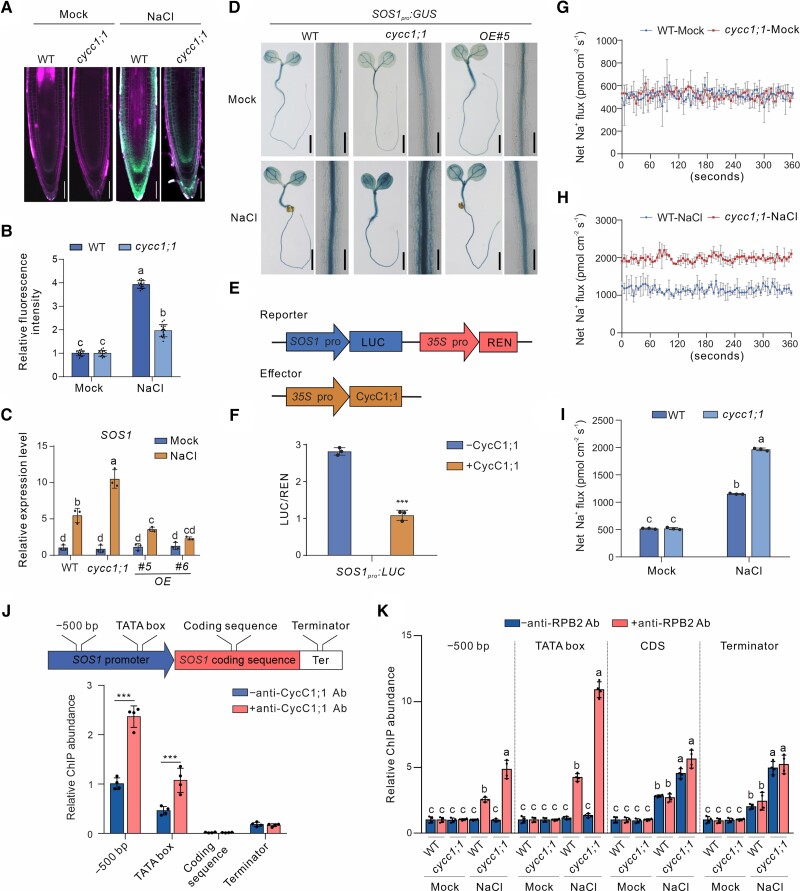
Figure 2.
CycC1;1 negatively regulates salt-induced SOS1 expression in plants. A, B) Sodium accumulation in wild-type and cycc1;1 mutant seedling roots. Five-day-old wild-type and cycc1;1 seedlings were treated with 100 mM NaCl for 3 h and then stained in a 10 μM ENG-2 AM solution containing 0.05% Pluronic F-127 for 3 h. Fluorescence images A) were taken, and the ENG-2 AM fluorescence intensity B) was analyzed. Bar = 50 μm. Data are means ± Sd of 3 independent repeats (n = 15). Bars with different letters indicate significant differences at P < 0.05, revealed using ANOVA with a Tukey's multiple comparison test (Supplemental Data Set 1). C) The expression of SOS1 in the wild-type and cycc1;1 mutant seedlings subjected to salt stress. Seven-day-old wild-type and cycc1;1 mutant seedlings treated with or without 100 mM NaCl for 12 h. Data are means ± Sd (n = 3). Bars with different letters indicate significant differences at P < 0.05, revealed using ANOVA with a Tukey's multiple comparison test (Supplemental Data Set 1). D) GUS staining images of 5-d-old transgenic SOS1pro:GUS in the wild-type, cycc1;1, and OE backgrounds treated with 0 mM or 100 mM NaCl for 12 h. Bar = 0.5 cm. E, F) LUC reporter gene assay to examine the effect of CycC1;1 on SOS1 expression. The schematic diagram E) shows the reporters and effectors used in the assay. The relative LUC intensity F) represents the SOS1pro:LUC activity relative to the internal control (REN driven by 35Spro). The activity of SOS1pro:LUC without CycC1;1 expression was set to 1. Data are means ± Sd (n = 3). Asterisks indicate significant differences determined by Student's t test (***P < 0.001). G to I) NMT showing Na+ fluxes. Ten-day-old wild-type and cycc1;1 mutant seedlings cultured in 1/2× MS liquid medium were treated with 0 mM G) or 150 mM NaCl H) for 5 h, and then the continuous transient Na+ fluxes were recorded for about 6 min. Each point is the mean of 4 individual plants. Quantitative analysis of the means of net Na+ fluxes within a continuous period of 0 to 6 min I). Data are means ± Sd (n = 3). Bars with different letters indicate significant differences at P < 0.05, revealed using ANOVA with a Tukey's multiple comparison test (Supplemental Data Set S1). J) A diagram showing the positions of SOS1 gene primers used for ChIP-qPCR is shown at the top. The ChIP-qPCR results showing the association of CycC1;1 with SOS1 is shown at the bottom. Chromatin was extracted from 7-d-old wild-type seedlings and then precipitated with either an anti-CycC1;1 antibody (+Ab) or only IgG (−Ab). Data are means ± Sd (n = 3). Asterisks indicate significant differences determined by Student's t test (***P < 0.001). K) Occupancy of RNAP II at the SOS1 promoter in the wild-type and cycc1;1 mutants. Chromatin was extracted from 7-d-old wild-type and cycc1;1 mutant seedlings and precipitated with an anti-RPB2 antibody (+RPB2) or only IgG (−RPB2). Data are means ± Sd (n = 4). Bars with different letters indicate significant differences at P < 0.05, determined using ANOVA with a Tukey's multiple comparison test.

