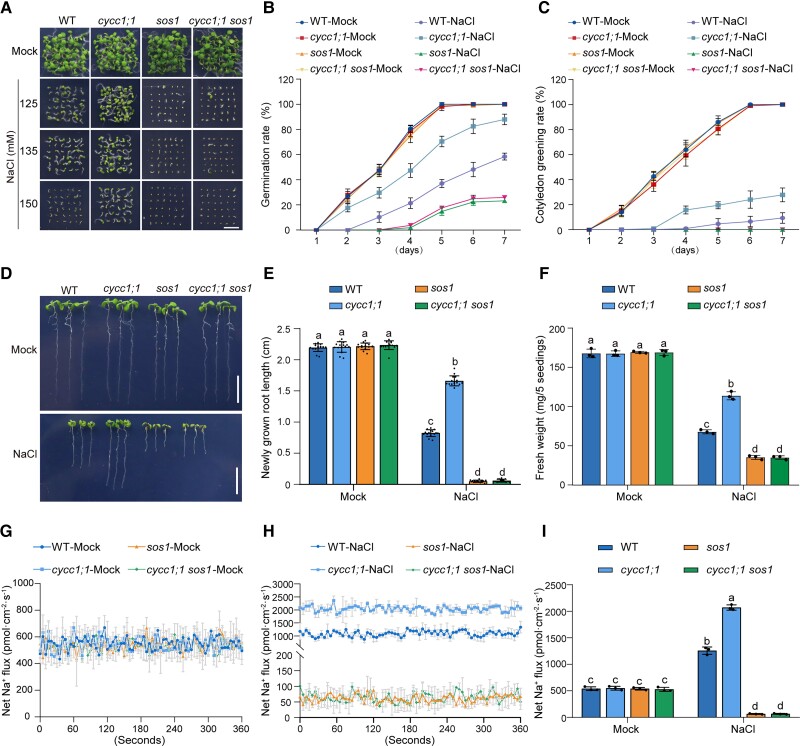
Figure 3.
CycC1;1 affects plant salt tolerance through SOS1. A to C) Phenotypes A) of the wild-type, cycc1;1, sos1, and cycc1;1 sos1 plants grown on 1/2× MS medium supplemented with 0 mM, 125 mM, 135 mM, or 150 mM NaCl for 5 d. Quantitative analysis of seed germination B) and cotyledon greening rates C) of plants grown on 1/2× MS medium supplemented with 0 mM or 125 mM NaCl for 7 d. Data are means ± Sd of 3 independent experiments (n = 3). D to F) Root elongation and fresh weight analysis. Five-day-old wild-type, cycc1;1, sos1, and cycc1;1 sos1 plants were transferred to 1/2× MS medium supplemented with 0 mM or 125 mM NaCl for additional growth. The photographs were taken 5 d after transfer D). Bar = 1 cm. The lengths of newly grown roots E) and the fresh weights F) of the seedlings were also analyzed. Data are means ± Sd (n = 15 for root length and n = 3 for fresh weight). Bars with different letters indicate significant differences at P < 0.05, revealed using ANOVA with a Tukey's multiple comparison test (Supplemental Data Set 1). G to I) Net Na+ fluxes in root tips using NMT. Ten-day-old wild-type, cycc1;1, sos1, and cycc1;1 sos1 mutant seedlings cultured in 1/2× MS liquid medium were treated with 0 mM G) or 150 mM NaCl H) for 5 h, and then continuous transient Na+ fluxes were recorded for about 6 min. Each point is the mean of data from 4 individual plants. Quantitative analysis of the means of net Na+ fluxes within a continuous period of 0 to 6 min I). Data are means ± Sd (n = 3). Bars with different letters indicate significant differences at P < 0.05, revealed using ANOVA with a Tukey's multiple comparison test.

