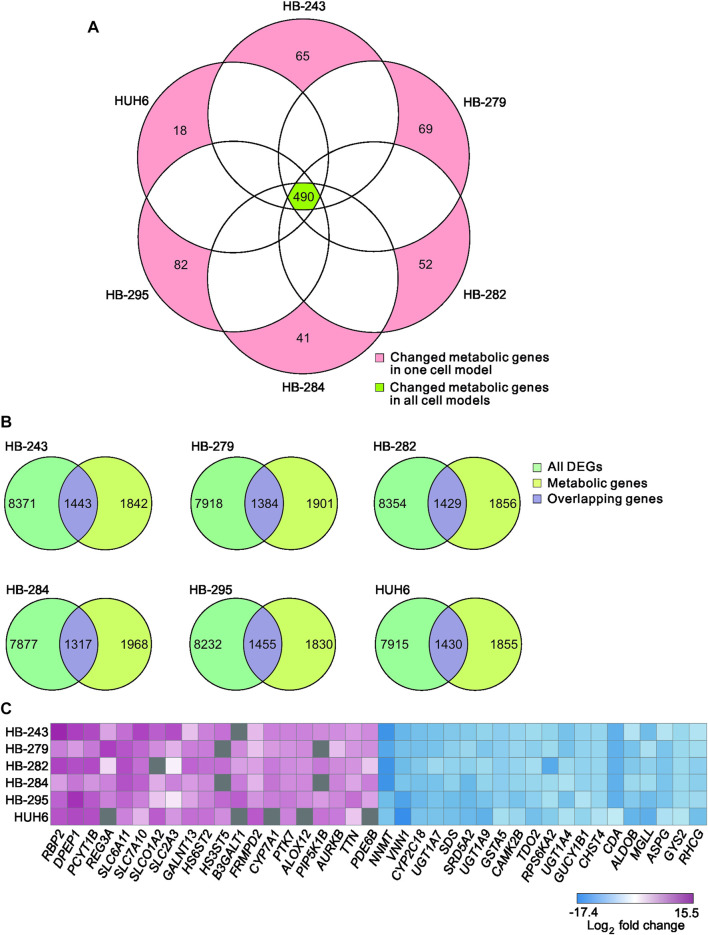
FIGURE 3.
Differentially expressed metabolic genes in HB cell models Venn diagram showing the number of shared metabolic genes among the 6 HB cell lines (A). Overlap of differentially expressed genes in each cell line and the list of all metabolic genes (B). Heatmap of the 20 most up- and the 20 most downregulated metabolic genes in HB cell models (C). Genes in gray = change not statistically significant.

