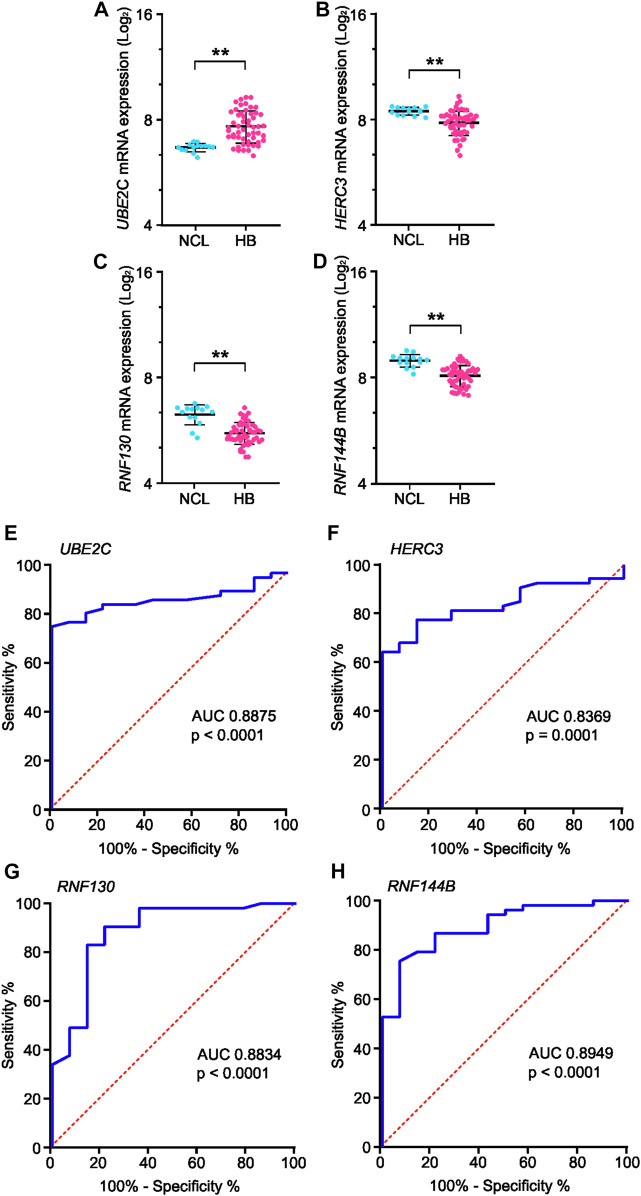
FIGURE 6.
mRNA expression and ROC curve analysis of the four key genes in GSE131329 dataset. Expression of UBE2C (A), HERC3 (B), RNF130 (C) and RNF144B (D) in HB samples compared to noncancerous liver samples on mRNA level. ROC curve analysis of UBE2C (E), HERC3 (F), RNF130 (G) and RNF144B (H) assessing the suitability of each gene for discrimination of noncancerous liver (NCL) and HB. ** = p < 0.01. Grey dots represent gene expression of independent patients, the whiskers represent the first and third quartile, and the thick solid line is median (A–D).

