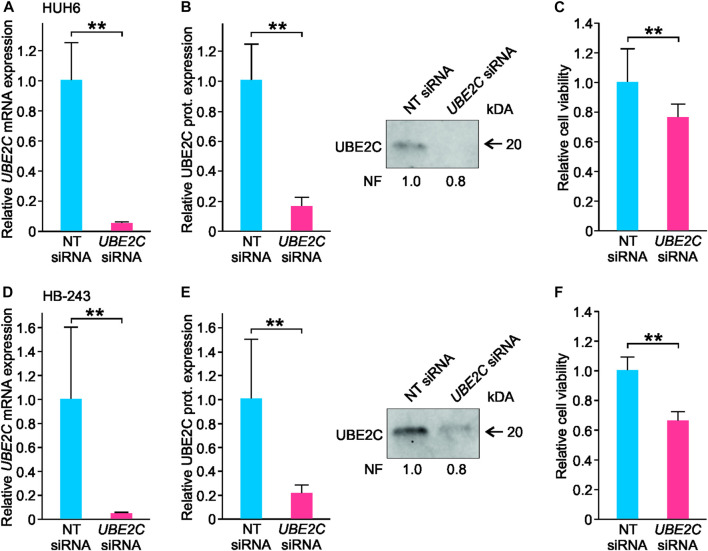
FIGURE 9.
Knockdown of UBE2C and its effect on HUH6 and HB-243 cell viability. Following the siRNA transfection, UBE2C mRNA expression in HUH6 was reduced by 95% (A) and protein expression by 80% (B) compared to cells transfected with non-targeting (NT) siRNA. In HB-243, UBE2C mRNA expression was reduced by 98% (D) and protein expression by 80% (E). WST-1 assay showed a 24% decrease in HUH6 (C) and 44% in HB-243 (F) in cell viability after UBE2C silencing. Bar plots are presented as relative values of mean of three independent experiments ± RSD. **p-value <0.01, NT = non-targeting. Normalization factor (NF) describing the amount of total protein in lane in relation to other lanes is given beneath the bands (B, E).

