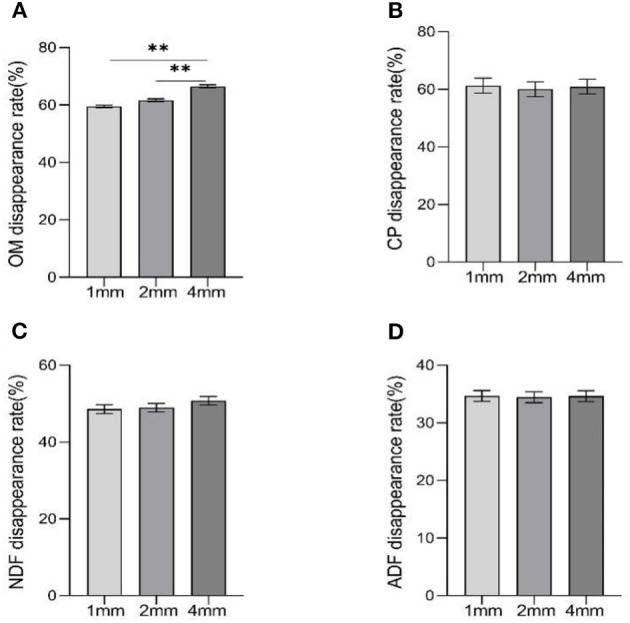
Figure 2.

The effects of different straw particle size on disappearance rate of nutrients. Data were shown as means ± SEM, significant (p < 0.05) or highly significant (p < 0.01) statistical differences were represented by * or **. (A–D) are the disappearance rates of OM, CP, NDF, and ADF, respectively.
