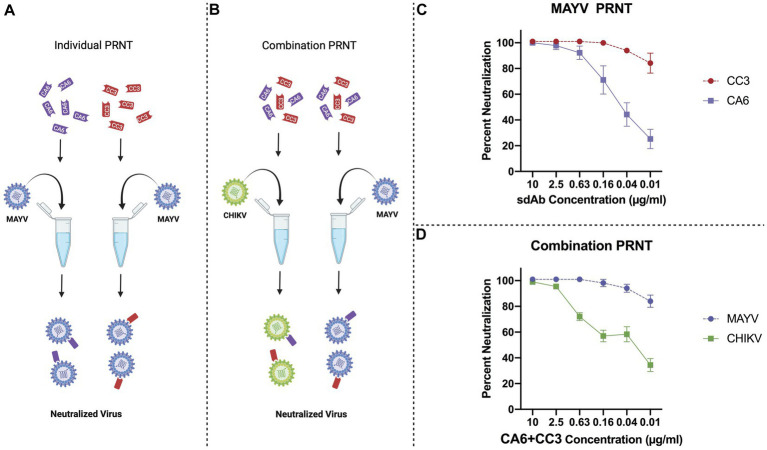
Figure 3.
General schematic of PRNT methods and virus neutralization data. (A) Schematic representing PRNT method of MAYV neutralization using CA6 (dark purple) and CC3 (red). (B) Schematic representing combination PRNT method of CHIKV (green) and MAYV (light purple) neutralization via samples mixed with both CA6 (dark purple) and CC3 (red). (C) PRNT data provides percent neutralization of MAYV by CC3 (red, circles, dashed line) and CA6 (dark purple, squares, solid line). (D) Combination PRNT data provides percent neutralization of MAYV (purple, circles, dashed line) and CHIKV (green, squares, solid line) by mixed samples of both CA6 and CC3. Purified sdAb samples were serially diluted in viral diluent to the appropriate concentration (10 μg/mL–0.01 μg/mL) and then mixed with an equal volume of the respective virus at 1,000 PFU/ml. Data points are representative of six replicates obtained in two independent experiments. Error bars represent SD.

