
Figure 3.
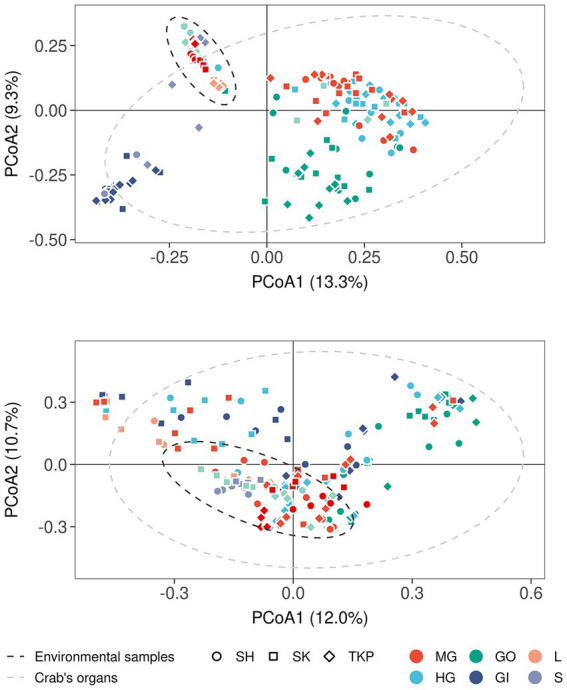
Microbial distribution according to Bray-Curtis distance. Principal coordinates analyses on Bray-Curtis distances inferred form 16S rRNA (A) and ITS1 metabarcoding (B). The percentage of variance explained by each axis was reported between round brackets whereas different sample types were reported using different colors (MG, midgut; HG, hindgut; GO, gonads; GI, gills; L, litter; S, soil; W, water; WD, water debris). Sample collected from different sites were reported by using different shapes (SH, Shui Hau; SK, Sai Keng; TKP, To Kwa Peng) whereas the 95% confidence intervals of the distribution of environmental samples (dark gray ellipse) and crab’s organs (light gray ellipse) were reported by using dotted lines assuming a multivariate t-distribution.