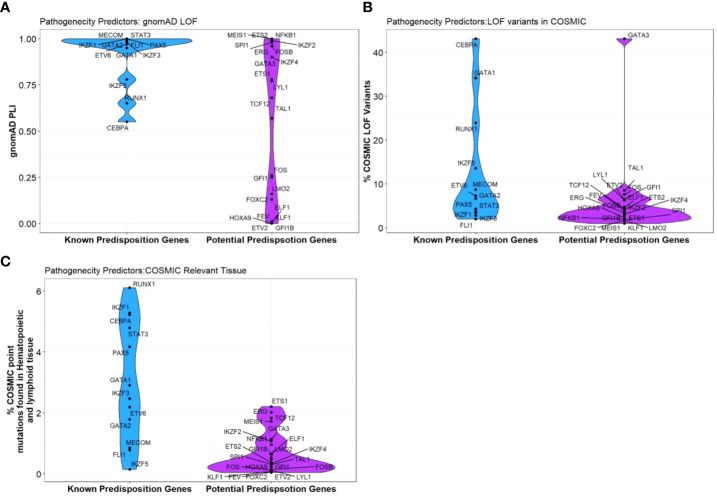
Figure 3.
Pathogenicity predictors for TFs implicated in predisposition to BMF and HM. Comparison of pathogenicity predictor score for known predisposition TFs and potential TF genes isolated from Table 1. (A) The Probability of being loss-of-function (LOF) intolerant (pLI) score of each gene was collated using the gnomAD database (version 2.1.1). The pLI score reflects the tolerance of a given gene to the LOF based on the number of protein-truncating variants referenced in control databases weighted by the size of the gene and the sequencing coverage. The pLI score ranges from 0-1, where higher the score, the higher the intolerance of the gene. (B) Percentage of gene LOF variants in COSMIC database. The total number of somatic LOF variants within a particular gene were calculated by totaling positive mutation data for the selected gene. Variants called ‘LOF’ included nonsense substitutions, frameshift insertions and frameshift deletions. Percentage calculated using LOF variants over the total number of unique samples of each gene. (C) Percentage of point mutations observed in hematopoietic and lymphoid tissues. The distribution of mutations across the primary hematopoietic and lymphoid tissues curated by COSMIC were collated. The percentages were calculated by totaling the number of point mutations of each gene, over the total samples tested.

