FIGURE 3.
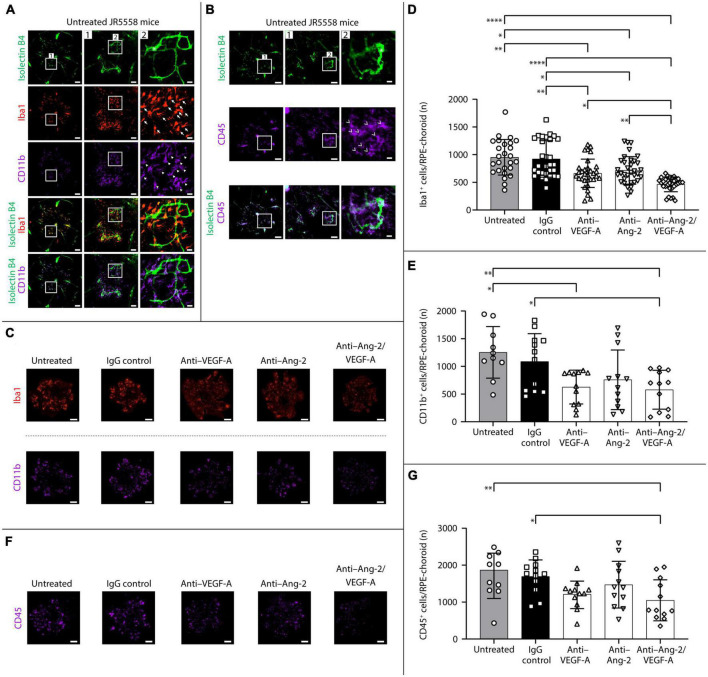
Dual angiopoietin-2 (Ang-2)/vascular endothelial growth factor-A (VEGF-A) inhibition reduces subretinal ionized calcium binding adapter molecule 1 (Iba1+), CD11b+, and CD45+ cell infiltration in JR5558 mice vs. anti-VEGF alone. (A,B) Representative isolectin B4 (white asterisk), Iba1, CD11b, and CD45 immunostaining images detected on retinal pigment epithelium (RPE)/choroid flatmounts from untreated JR5558 mice, allowing visualization and quantification of subretinal Iba1+ (white arrows), CD11b+ (white triangles), and CD45+ (white arrowhead) immune cells infiltration. Scale bar = 500, 100 (1), and 25 (2) μm. (C) Representative analysis by immunofluorescence staining of Iba1 or CD11b on RPE/choroid flatmounts in JR5558 mice 1 week after treatment with immunoglobulin G (IgG) control or anti–VEGF-A, anti–Ang-2, or bi-specific anti–Ang-2/VEGF-A antibodies. Scale bar = 500 μm. (D,E) Total number of Iba1+ (D) or CD11b+ (E) inflammatory cells around choroidal neovascularization (CNV) lesions on RPE/choroid whole flatmounts in JR5558 mice 1 week after treatment with IgG control or anti–VEGF-A, anti–Ang-2, or bi-specific anti–Ang-2/VEGF-A antibodies [n = 26–34 flatmounts for panel (D) and n = 10–12 flatmounts for panel (E)]. (F) Representative immunofluorescence staining of CD45 on RPE/choroid flatmounts in JR5558 mice 1 week after treatment with IgG control, anti–VEGF-A, anti–Ang-2, or bi-specific anti–Ang-2/VEGF-A antibodies. Scale bar = 500 μm. (G) Total number of CD45+ inflammatory cells around CNV lesions on RPE/choroid whole flatmounts 1 week after treatment with IgG control or anti–VEGF-A, anti–Ang-2, or bi-specific anti–Ang-2/VEGF-A antibodies (n = 10–12 flatmounts). Values are mean ± SD. One-way analysis of variance followed by Tukey’s multiple comparison test. *P < 0.05, **P < 0.01, ****P < 0.0001.

